

Volume 10, Issue 4 (2024)
Pharm Biomed Res 2024, 10(4): 303-318 |
Back to browse issues page


Download citation:
BibTeX | RIS | EndNote | Medlars | ProCite | Reference Manager | RefWorks
Send citation to:


BibTeX | RIS | EndNote | Medlars | ProCite | Reference Manager | RefWorks
Send citation to:
Shaik B, Swain B, Gupta Maddi E, Maddi S. Novel RP-UFLC Methodology for Concurrent Assessment of Curcumin, Resveratrol, Silybin, and Mangiferin From Topical Hydrogels. Pharm Biomed Res 2024; 10 (4) :303-318
URL: http://pbr.mazums.ac.ir/article-1-603-en.html
URL: http://pbr.mazums.ac.ir/article-1-603-en.html


1- Formulation and Analytical Research and Development Division, Acubiosys Private Limited, Hyderabad, India.
2- Department of Biopharmaceutics and Pharmaceutical Technology, Krupanidhi College of Pharmacy, Bangalore, India.
2- Department of Biopharmaceutics and Pharmaceutical Technology, Krupanidhi College of Pharmacy, Bangalore, India.
Full-Text [PDF 1868 kb]
(639 Downloads)
| Abstract (HTML) (2411 Views)
Full-Text: (467 Views)
Introduction
Mangiferin (MF), resveratrol (RV), silybin (SB), and curcumin (CR) are bioactive compounds found in various plant sources (Mangifera indica L., Vitis vinifera, Silybum marianum, and Curcuma longa, respectively) that have been thoroughly researched for their possible health advantages. These substances have neuroprotective, anti-inflammatory, anticancer, and antioxidant qualities. In terms of its pharmacokinetic properties, these compounds are well tolerated at higher concentrations but they have relatively less bioavailability, which may have been due to poor solubility, low absorption, rapid metabolism, and excretion [1, 2].
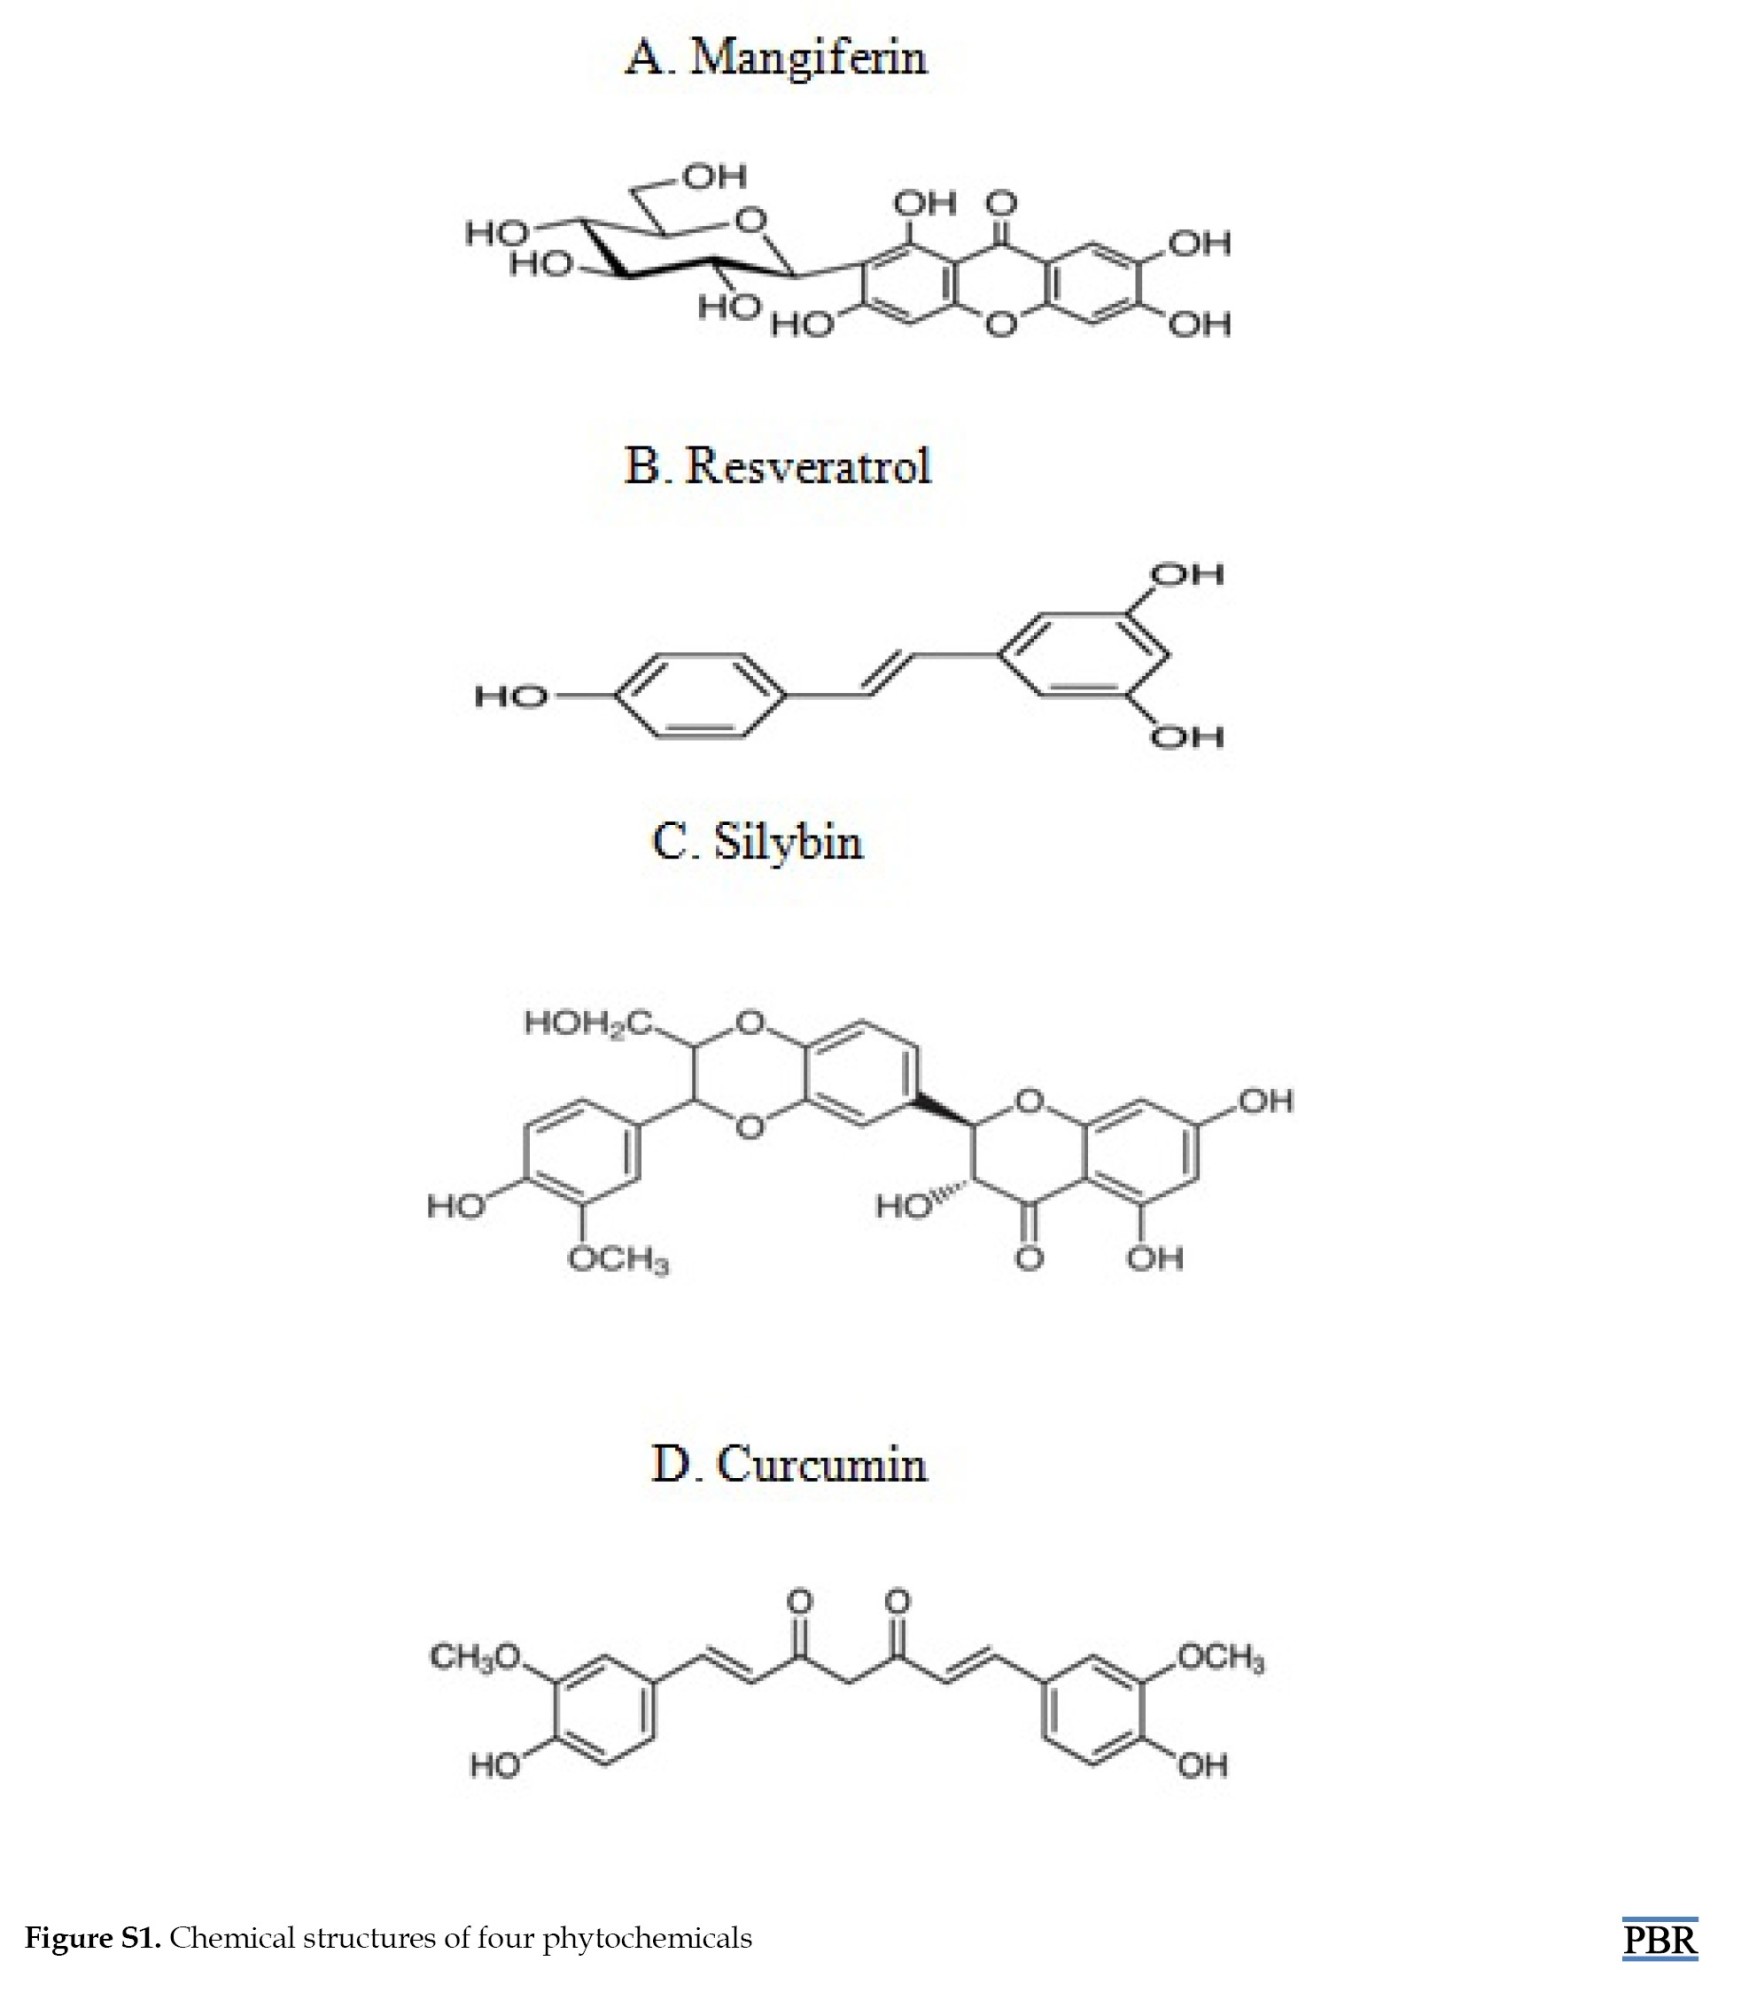
The chemical structures are as follows: MF (2-b-D-glucopyranosyl-1,3,6,7-tetrahydroxyxanthone), RV (trans-1,2-(3,4,5-trihydroxydiphenyl)ethylene,3,4,5-trihydroxy-trans-stilbene), SB (2R,3S)-3,5,7-trihydroxy-2-[3-(4-hydroxy-3-methoxyphenyl)-2-(hydroxymethyl)-2,3-dihydro-1,4-benzodioxin-6-yl]-2,3-dihydrochromen-4-one), and CR (E,E)-1,7-Bis(4-hydroxy-3-methoxyphenyl)-1,6-heptadiene-3,5-dione. These structures are shown in Figure S1.
 Additionally, S. marianum fruits are used for the production of milk in mothers, the treatment of liver dysfunctions, gallbladder disorders, and hepatoprotective; meanwhile, it was officially classified by the World Health Organization (WHO) in the 1970s [3]. Additionally, the Food and Drug Administration (FDA) has approved CR as safe. In animal studies, CR has been shown to have anti-inflammatory effects and to reduce skin psoriasis when applied topically as a 1% gel containing CR [4].
Various techniques for analyzing the MF, RV, SB, and CR both alone and in conjunction with other medications have been documented in the literature. The literature survey indicates that there is currently no existing ultra-fast liquid chromatography (UFLC) technique for the simultaneous estimation of MF, RV, SB, and CR with an internal standard (IS). Consequently, the authors posited that the combined effect of these compounds could be beneficial in managing psoriasis. Accordingly, the current research is designed to develop a novel hydrogel, and a simple, cost-effective, accurate, precise, and validated UFLC method for the quantitative analysis of all samples. There was no marketed formulation combination of MF, RV, SB, and CR in hydrogel or any other dosage form used in medicine. As a result, a fixed-dose combination of hydrogel formulation was developed in the laboratory for the enhancement of topical bioavailability. The formulation incorporated poly-herbal compounds to minimize the complications associated with allopathic medicines. Herbal remedies have become increasingly popular for treating skin conditions.
Materials and Methods
Chemicals, solvents and reagents
MF (97%, CAS: 4773-96-0), RV (99%, CAS: 501-36-0), SB (98%, CAS: 36804-17-8), and CR (natural, CAS: 458-37-7) were purchased from Tokyo Chemical Industry Pvt. Ltd. (Hyderabad, India). Methanol and high-performance liquid chromatography (HPLC)-grade acetonitrile (ACN) were acquired from Merck Life Science Pvt. Ltd., and propylene glycol was purchased from Sigma-Aldrich Chemicals Pvt. Ltd. (Bengaluru, India). Formic acid, carbopol-940, and tri-ethylamine were purchased from Fisher Chemicals. Every chemical and reagent utilized in the investigation was of the highest caliber and purity.
Study instrumentation
An autosampler-mediated (SIL-20AC HT) UFLC (Shimadzu, Japan) equipped with a pump (LC-20AD), and a photodiode array (PDA) detection system (SPD-M20A) was utilized for the chromatographic separation. The oven (CTO-10AS VP), which can hold columns inside the chamber, was used to regulate the temperature of the columns. The Lab Solutions software, VERSION 6.86 SP2 was used for recording and integrating the chromatograms and a calibrated weighing machine (ME204/AD4, Mettler Toledo, Switzerland) was used for weighing all of the standards precisely.
Chromatographic conditions
MF, RV, SB, CR, and IS were separated by chromatography using a Shimadzu (Shim pack solar) C-18 column (250×4.6 mm, 5 µm). The method was devised using a mobile phase made up of 0.1% formic acid (solvent-A) in HPLC grade water and acetonitrile (solvent-B) in a gradient method. Before analysis, the mobile phase underwent a 10-min bath sonication and a 0.45-micron membrane filter with vacuum filtration assembly. The optimal distance between peaks was accomplished by applying solvent-B ranging from 40% over 0.01-11 min, 98% over 11.01-15 min, and maintained at 40% up to 15.01-20 min, at a flow rate of 1 mL/min and a column temperature of 40±0.2 °C keeping injection volume 20 µL.
Stock solution preparation
To create stock solutions, MF, RV, SB, or CR were dissolved in acetonitrile to yield solutions with a 1 mg/mL concentration. Albendazole was dissolved in ACN to create the IS stock solution, which had a 100 µg/mL concentration. The solution was kept at 4 °Ϲ in a refrigerator. A UFLC method was developed and validated, and sample solutions were prepared to investigate ex vivo cumulative percentage drug release.
Method validation
The UFLC/PDA method was validated by adhering to the guidelines set forth by the International Conference on Harmonization. Throughout the project, various validation parameters were examined, such as system suitability, the limit of detection (LOD), the limit of quantification (LOQ), linearity, range, accuracy, and precision [5].
The linearity of the method was evaluated through the injection of nine distinct pure drug standard concentrations, varying from 2 to 20 µg/mL. The proper concentrations of 1 mg/mL stock solution of MF, RV, SB, and [6, 7] were spiked to create the stocks.
Various concentrations, such as 16, 18, and 20 µg/mL of stock solutions containing MF, RV, SB, and CR within the linearity range were prepared. By injecting three identical dilutions of these concentrations into the system, the accuracy of the procedure was ascertained [8, 9].
Precision was evaluated in the form of percentage relative standard deviation (%RSD) between replicates, which must be less than 2%. This assessment was considered as repeatability, intermediate precision, and inter-day precision, To evaluate repeatability, six duplicates of 20 µg/mL stock solutions MF, RV, SB, and CR were injected into the UFLC system on a single day. The intermediate precision of the method was established by injecting three replicates of three concentration levels (16, 18, and 20 µg/mL) over three consecutive days [10, 11].
Three replicates of a single concentration of 2 µg/mL were injected into the UFLC system, and the outcome was noted, in determining the developed method’s sensitivity. The LOD and LOQ were calculated using the regression line equation (Equations 1 and 2) [12].
1. LOD=3.3×(Standard deviation of response)/(Slope of calibration curve)
2. LOQ=10×(Standard deviation of response)/(Slope of calibration curve)
Six injections of a 20 µg/mL stock solution concentration were used to test the system’s suitability. To determine whether the system was suitable, factors including peak area, retention time (Rt), number of theoretical plates (NTP), and tailing factor (Tf) were examined. The acceptance criteria for %RSD of peak area and Rt in replicate injections were <2, and that of Tf was <2. The limit for NTP was >2000, and for height equivalent to a theoretical plate, it was <2 [13].
The developed method’s selectivity was assessed by calculating six placebo hydrogel formulation samples containing all the excipients extracted with methanol. This was examined for any effects of the polymer matrix or formulation-related excipient interference with the drugs [14].
Gel preparation
The 1% gel was prepared by adding accurately weighed carbopol-940 to the required quantity of distilled water and allowing it to soak overnight to form a complete dispersion of the polymer. Triethanolamine was added to the carbopol-940 dispersion while continuously stirring for neutralization, to form an aqueous gel. To this gel, a required quantity of excipients such as 0.1% ethylene diamine tetra acetic acid as a preservative, 1% propylene glycol as an emollient, and 1% capryol-90 as a permeation enhancer were added. On the other hand, a required quantity of active compounds, 0.1% MF, 0.5% RV, 0.5% SB, and 0.5% CR, was added to 10% methanol as a solvent for the formation of an organic dispersion. This organic dispersion was added to the excipients-containing aqueous gel, mixed thoroughly using Remi RQ-121 purchased from Asian Scientific Instruments Hyderabad, to obtain a homogeneous mixture of hydrogel [15].
Sample extraction
The prepared hydrogel was precisely weighed from the tube, and the required quantity of methanol was mixed for the extraction of compounds to achieve concentrations within the linearity range. After centrifuging the mixture for 10 min at 3000 rounds per min (rpm) to ensure maximum retrieval of the sample compound, the mixture was sonicated for 10 min, and the supernatant was then collected [16].
The mice’s skin was removed and weighed accurately, and then chopped into small pieces. Four volumes of phosphate buffer saline at pH 7.4 were added to the mice’s skin, and the mixture was homogenized. To extract the compounds, the required quantity of methanol was added to achieve concentrations within the linearity range and centrifuged at 6000 rpm for around 10 min. The obtained supernatant was isolated and analyzed.
Drug content and homogeneity
The 20 µL of sample extract was injected into the system utilizing the developed method to measure the drug content. The regression equation of the calibration curve was used to determine the percentage of drug content.
Ex vivo drug release
The experiment utilized BLAB/c mice skin, which had already been utilized in standard pharmacological research. Using a scalpel, the non-dermatological skin was cut away, and the full-thickness skin was removed and cleaned with cold tap water. Potassium phosphate buffer (pH 7.4) was poured into the reservoir compartment. Skin with a 4.9 cm2 skin exposure area was sandwiched between the reservoir and donor compartments of the Franz diffusion cell. Meanwhile, 1 g of the formulation was applied to the skin-facing donor compartment. The apparatus was kept on continuous stirring and the temperature of 37±2 °C was maintained throughout the experiment. To maintain sink condition, 1 mL of sample was taken from the receptor compartment at predefined intervals (0.083, 0.25, 0.5, 1, 2, 4, 8, and 24 h) and replaced with an equal volume of fresh buffer solution. Regression equations derived from the standard graph were utilized to compute the percentage cumulative drug release from the formulation [17].
Results and Discussion
Optimization of chromatographic conditions
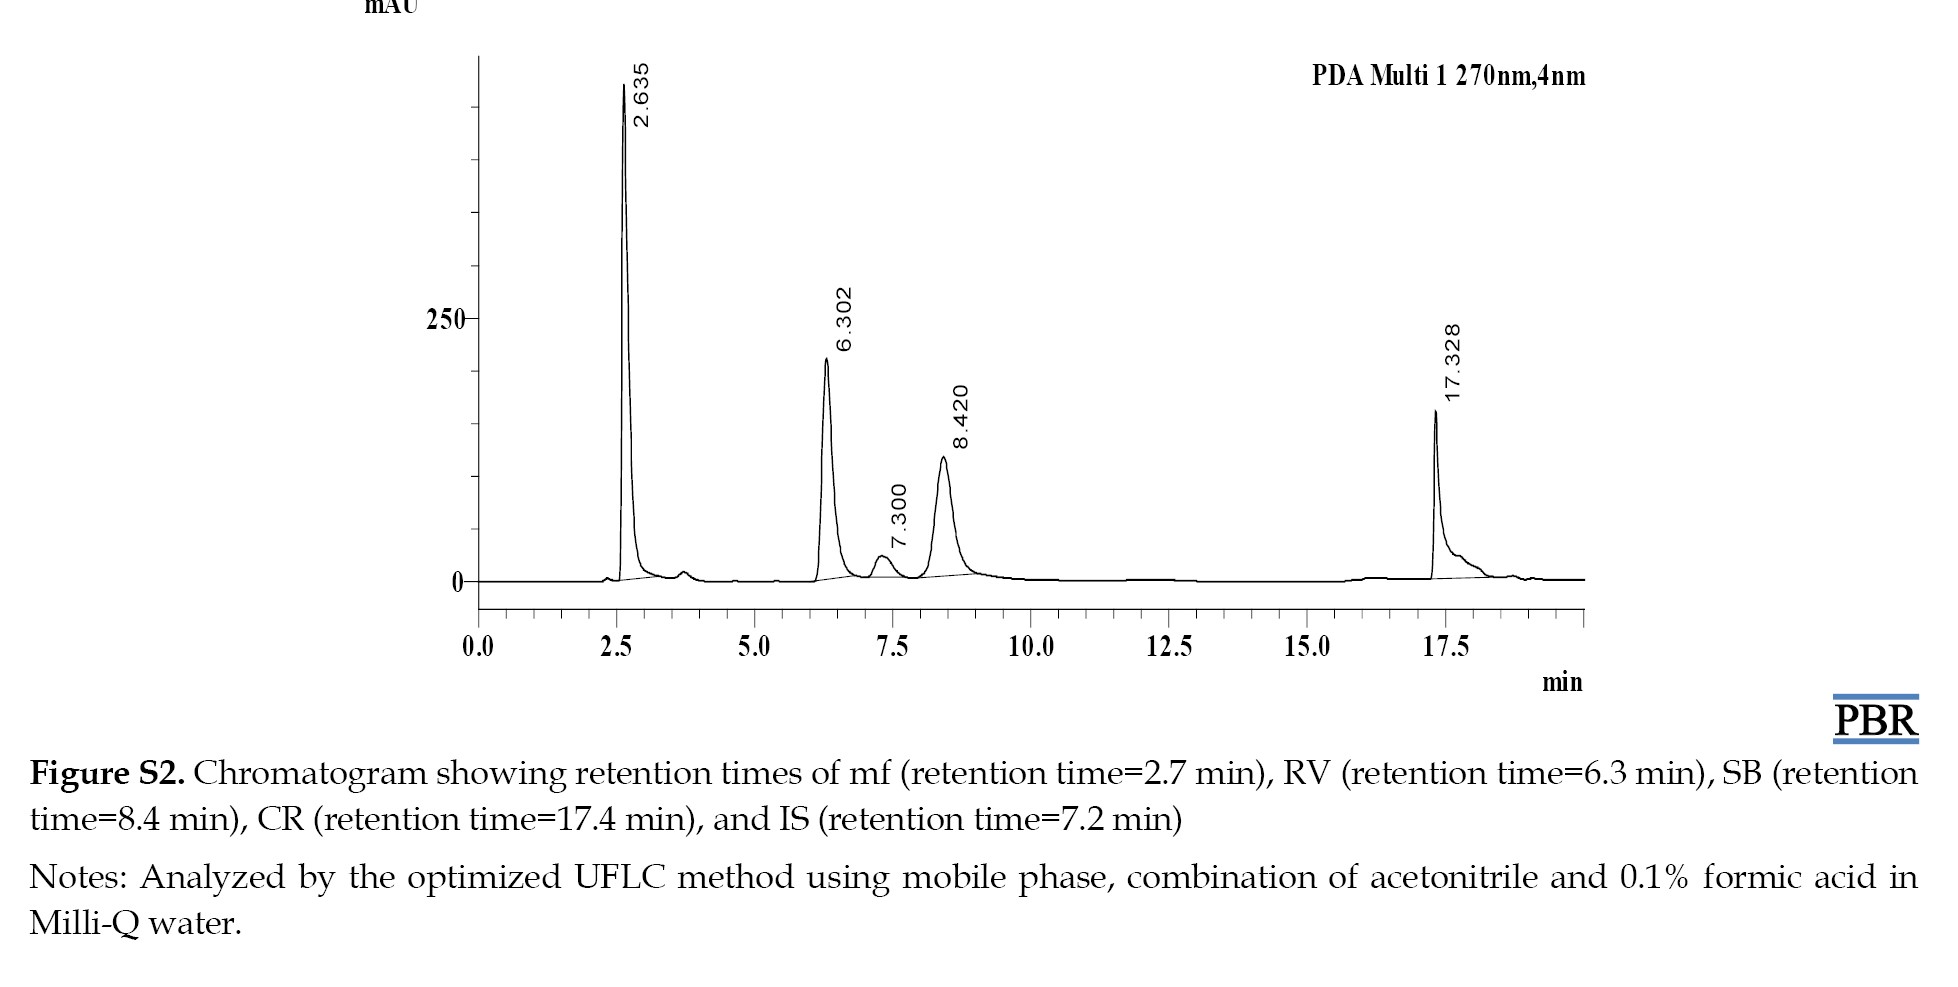
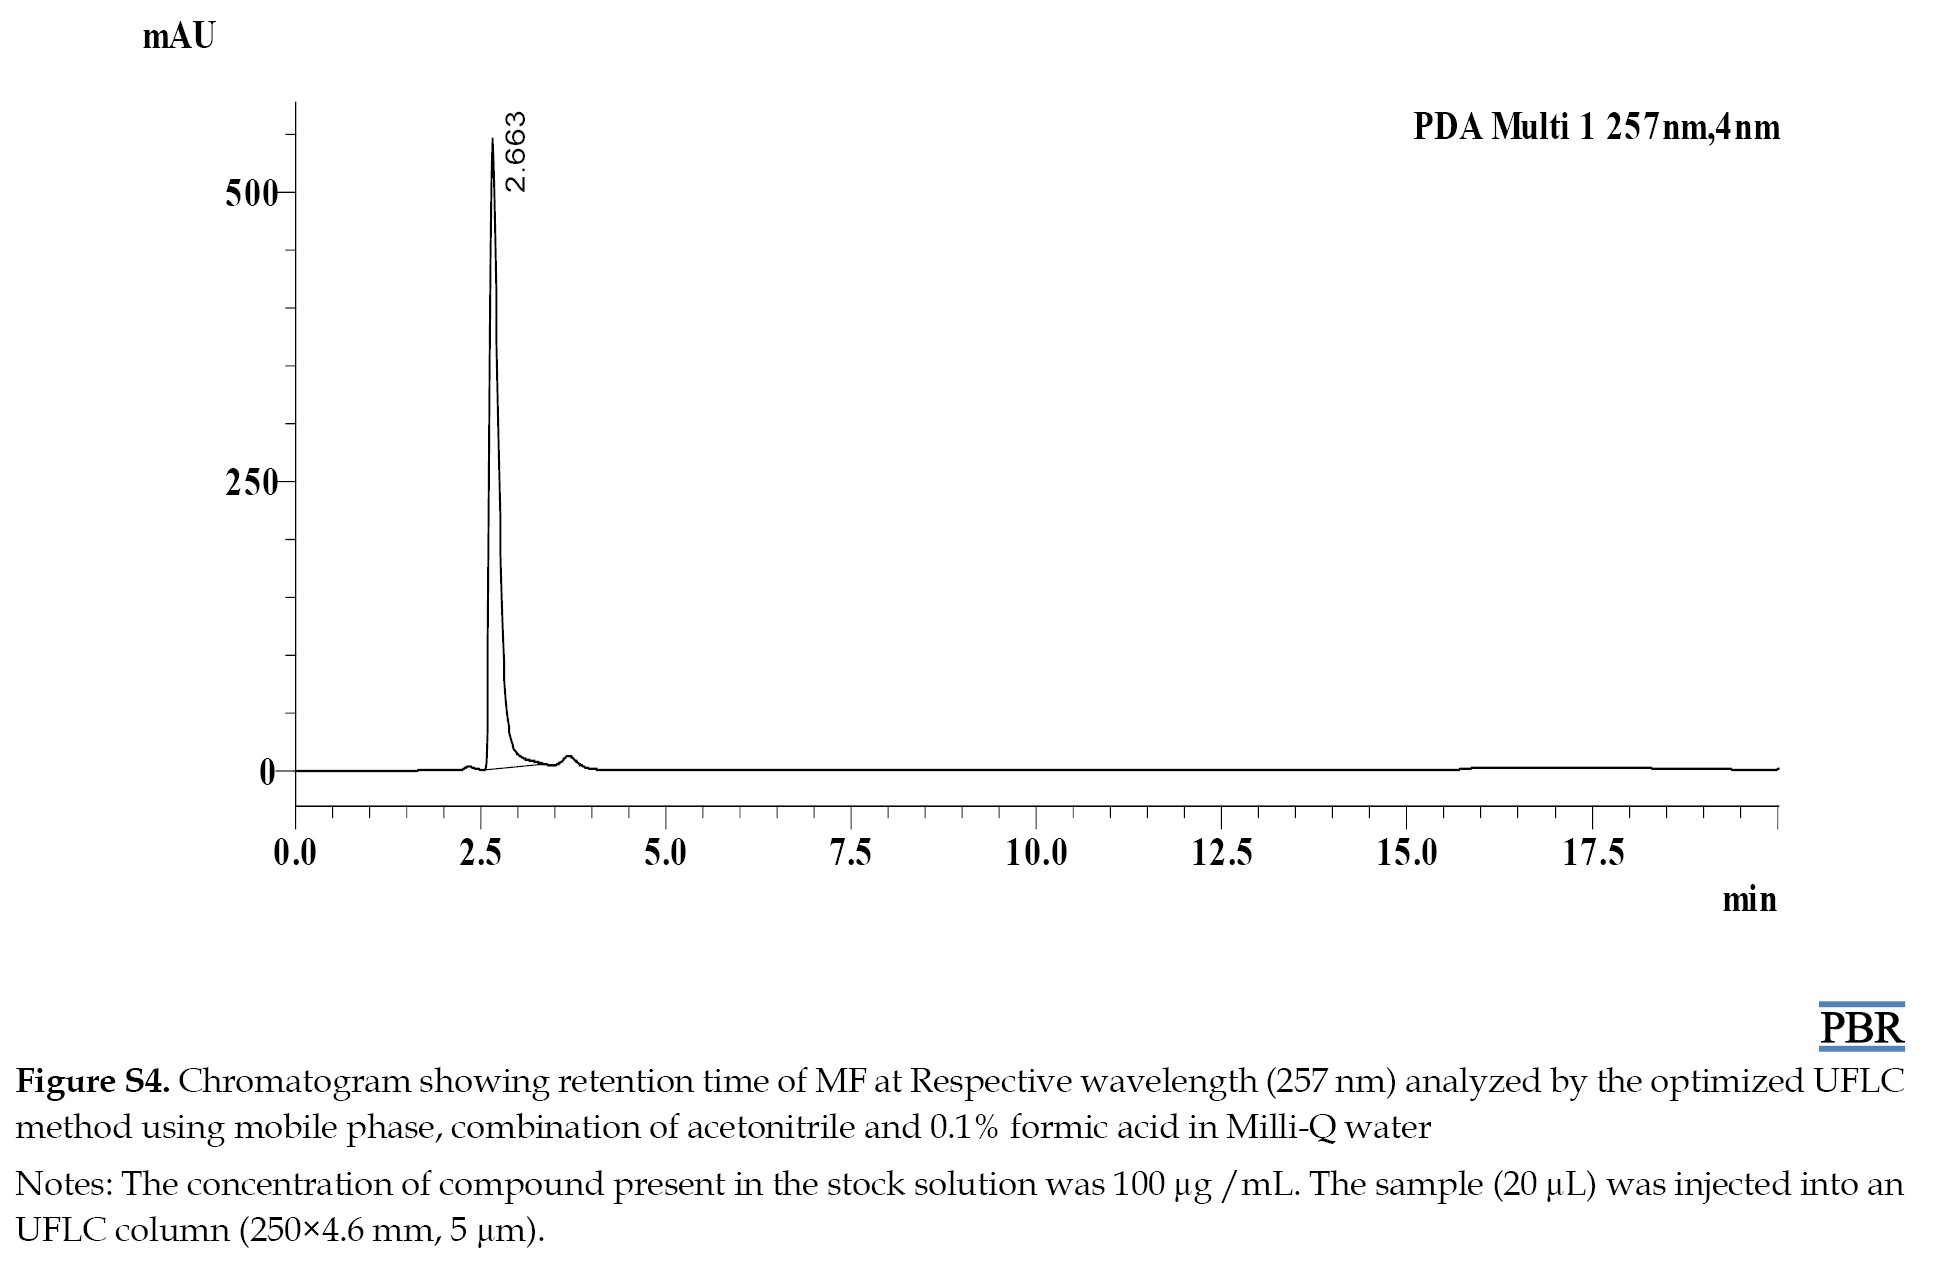
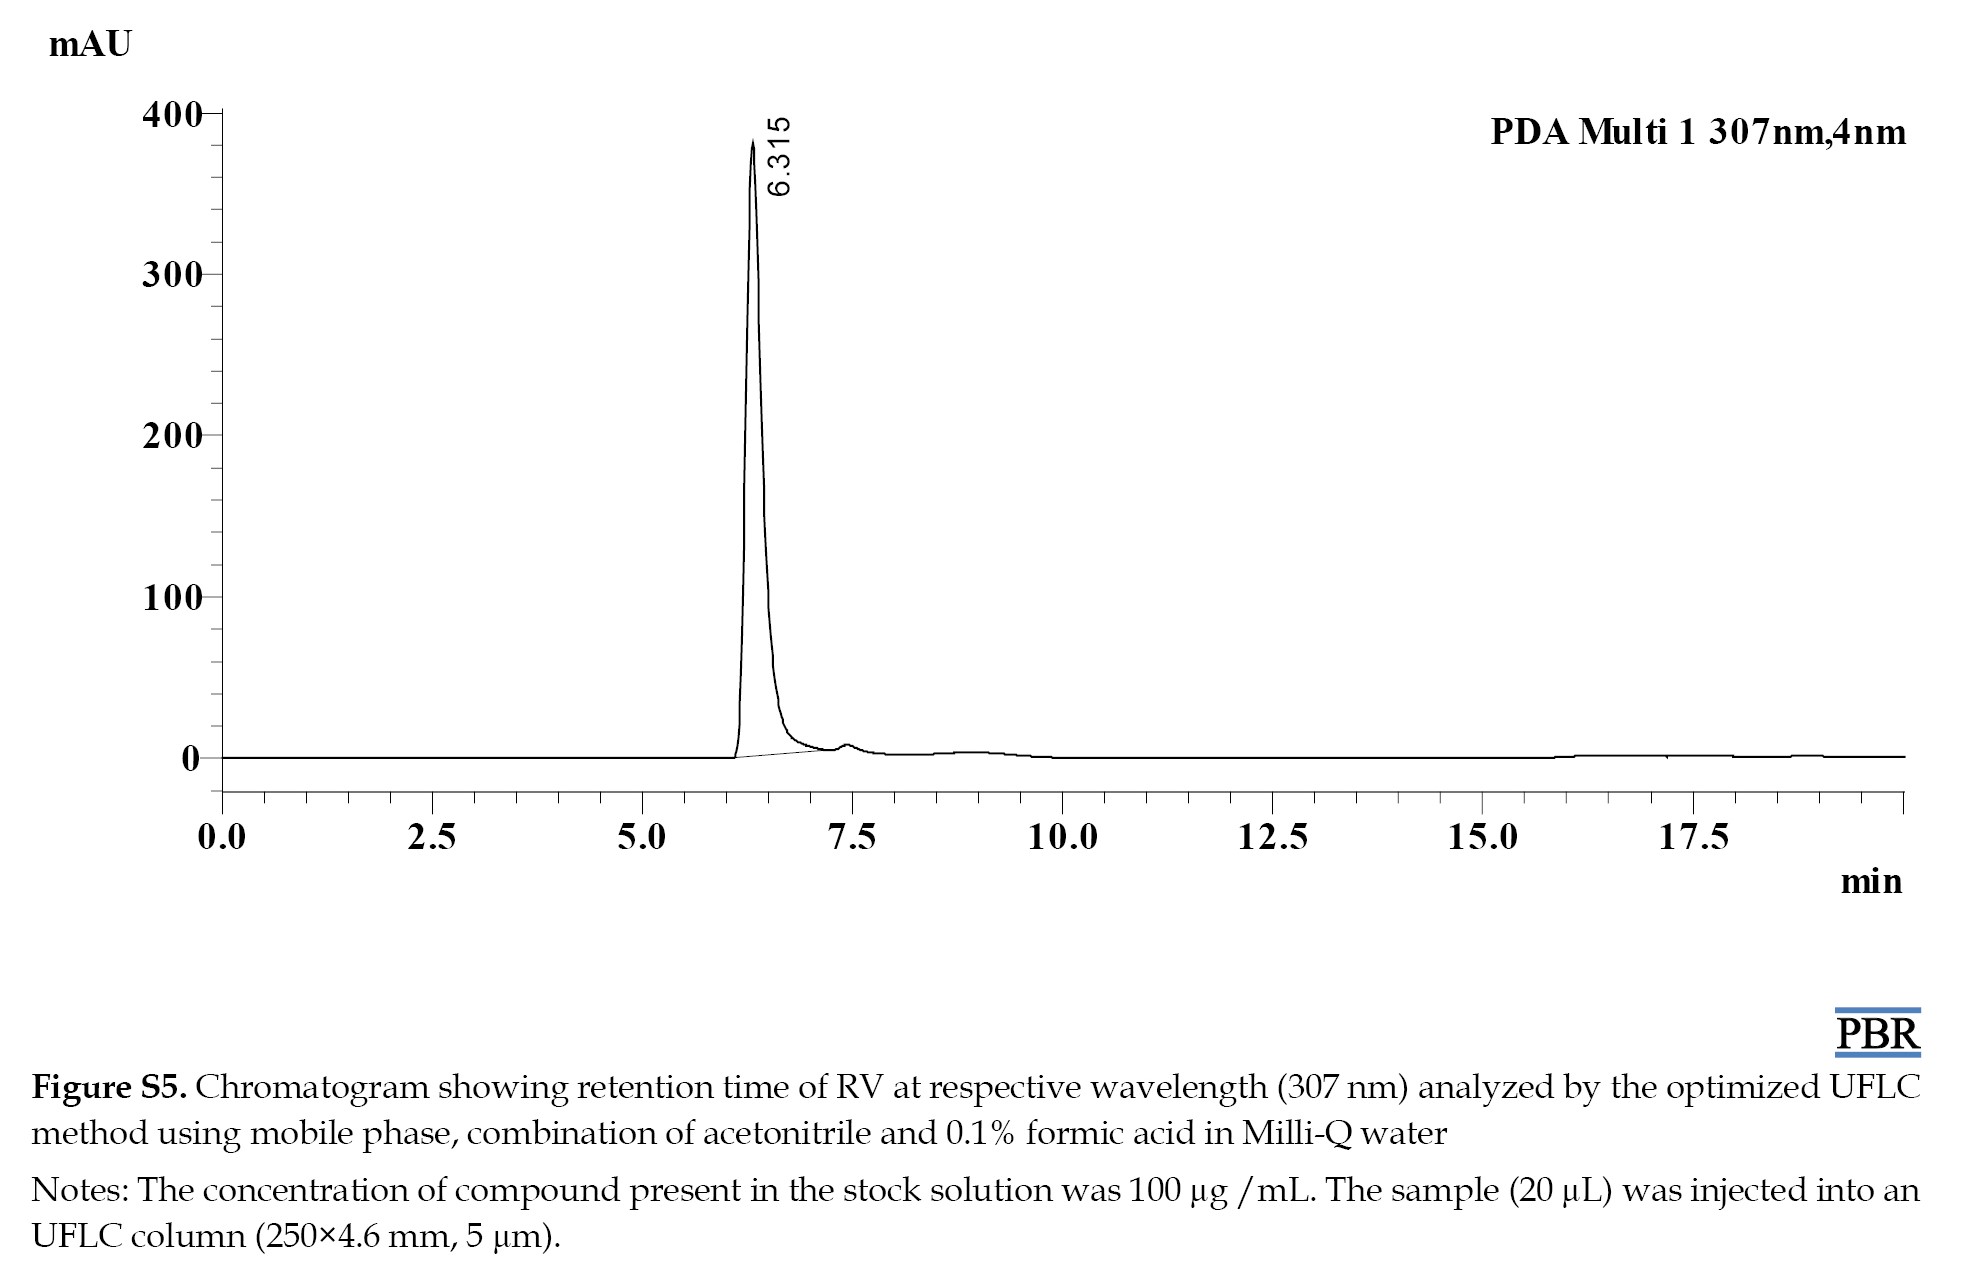
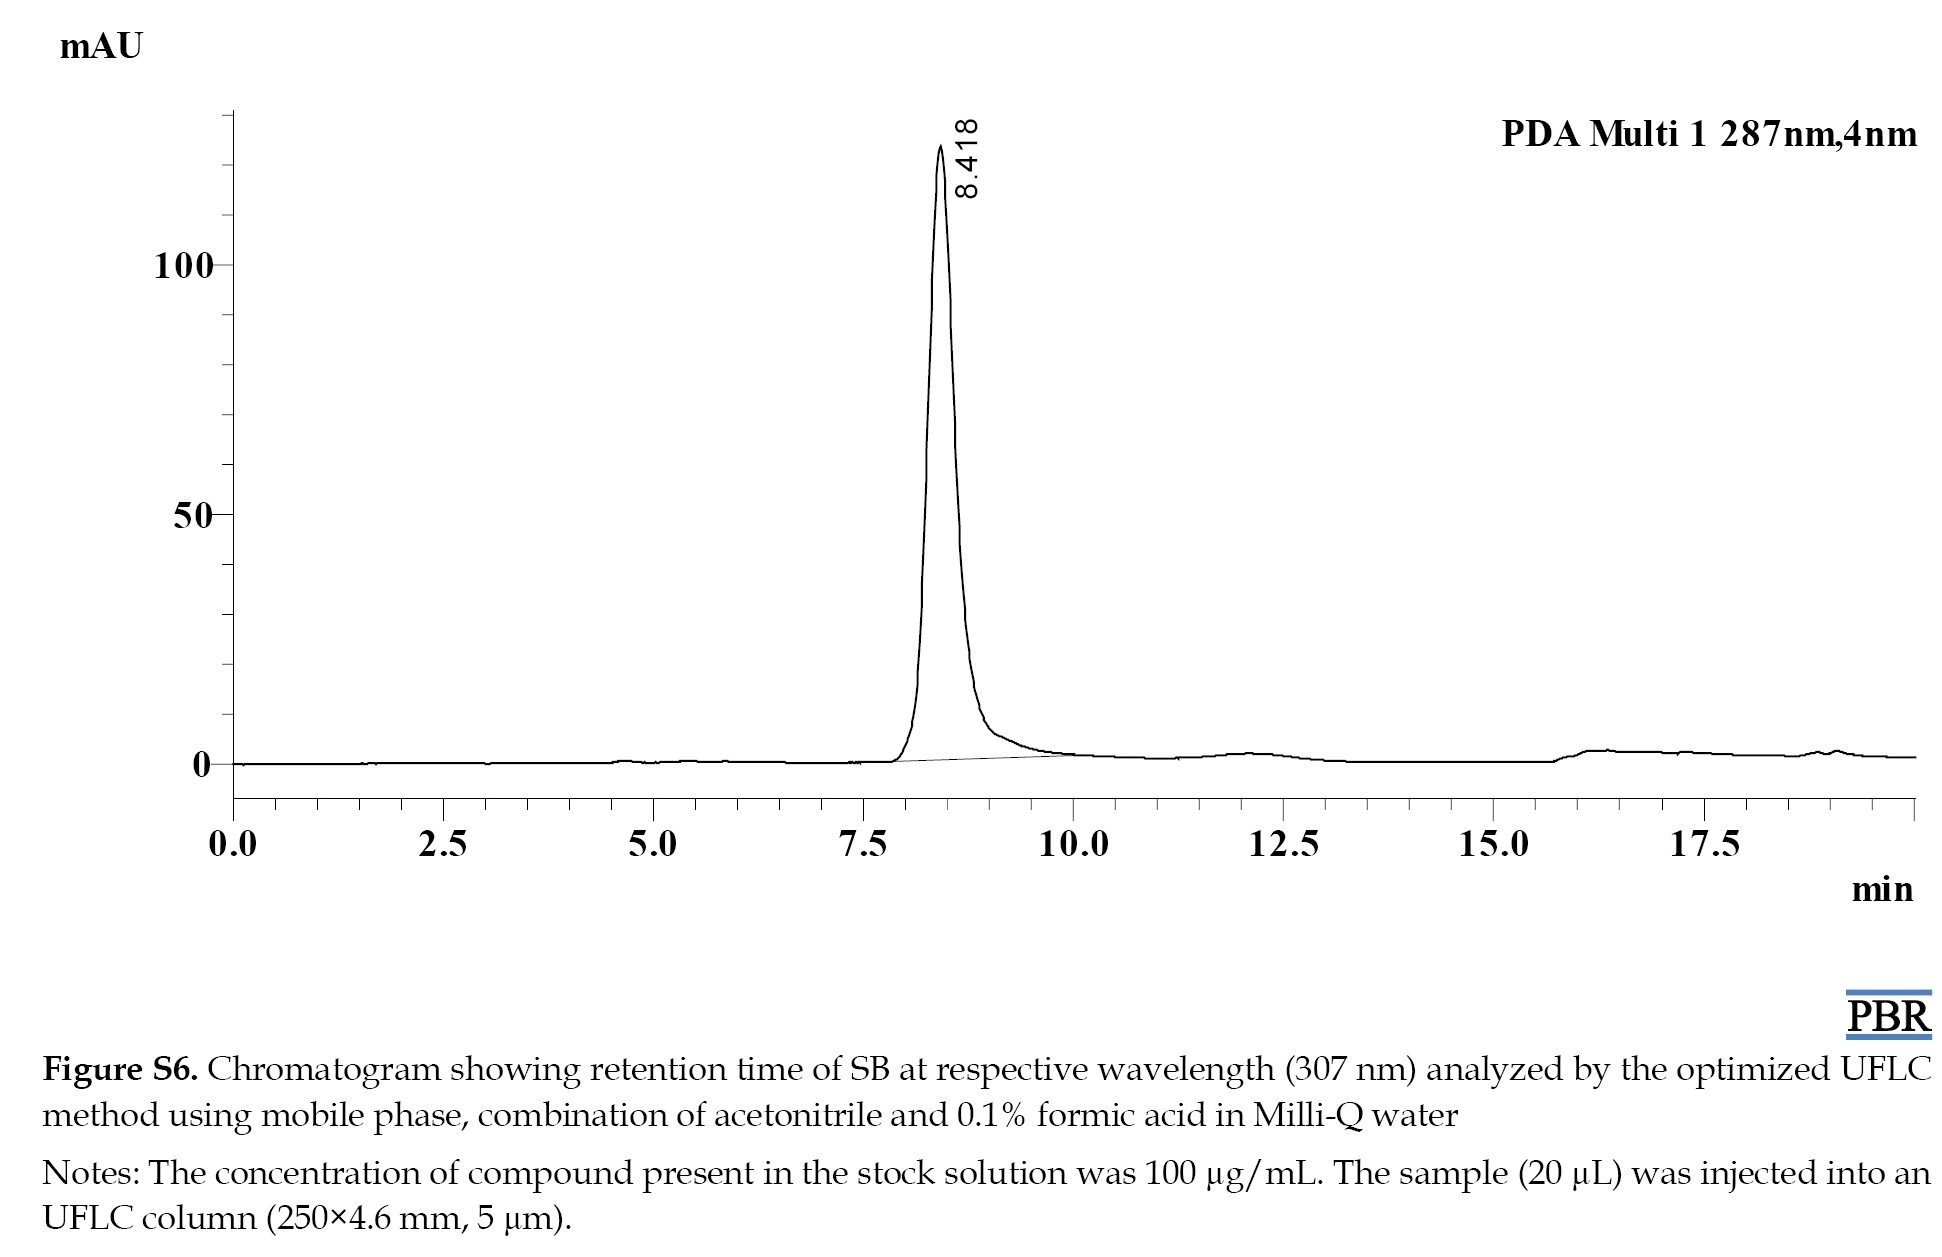
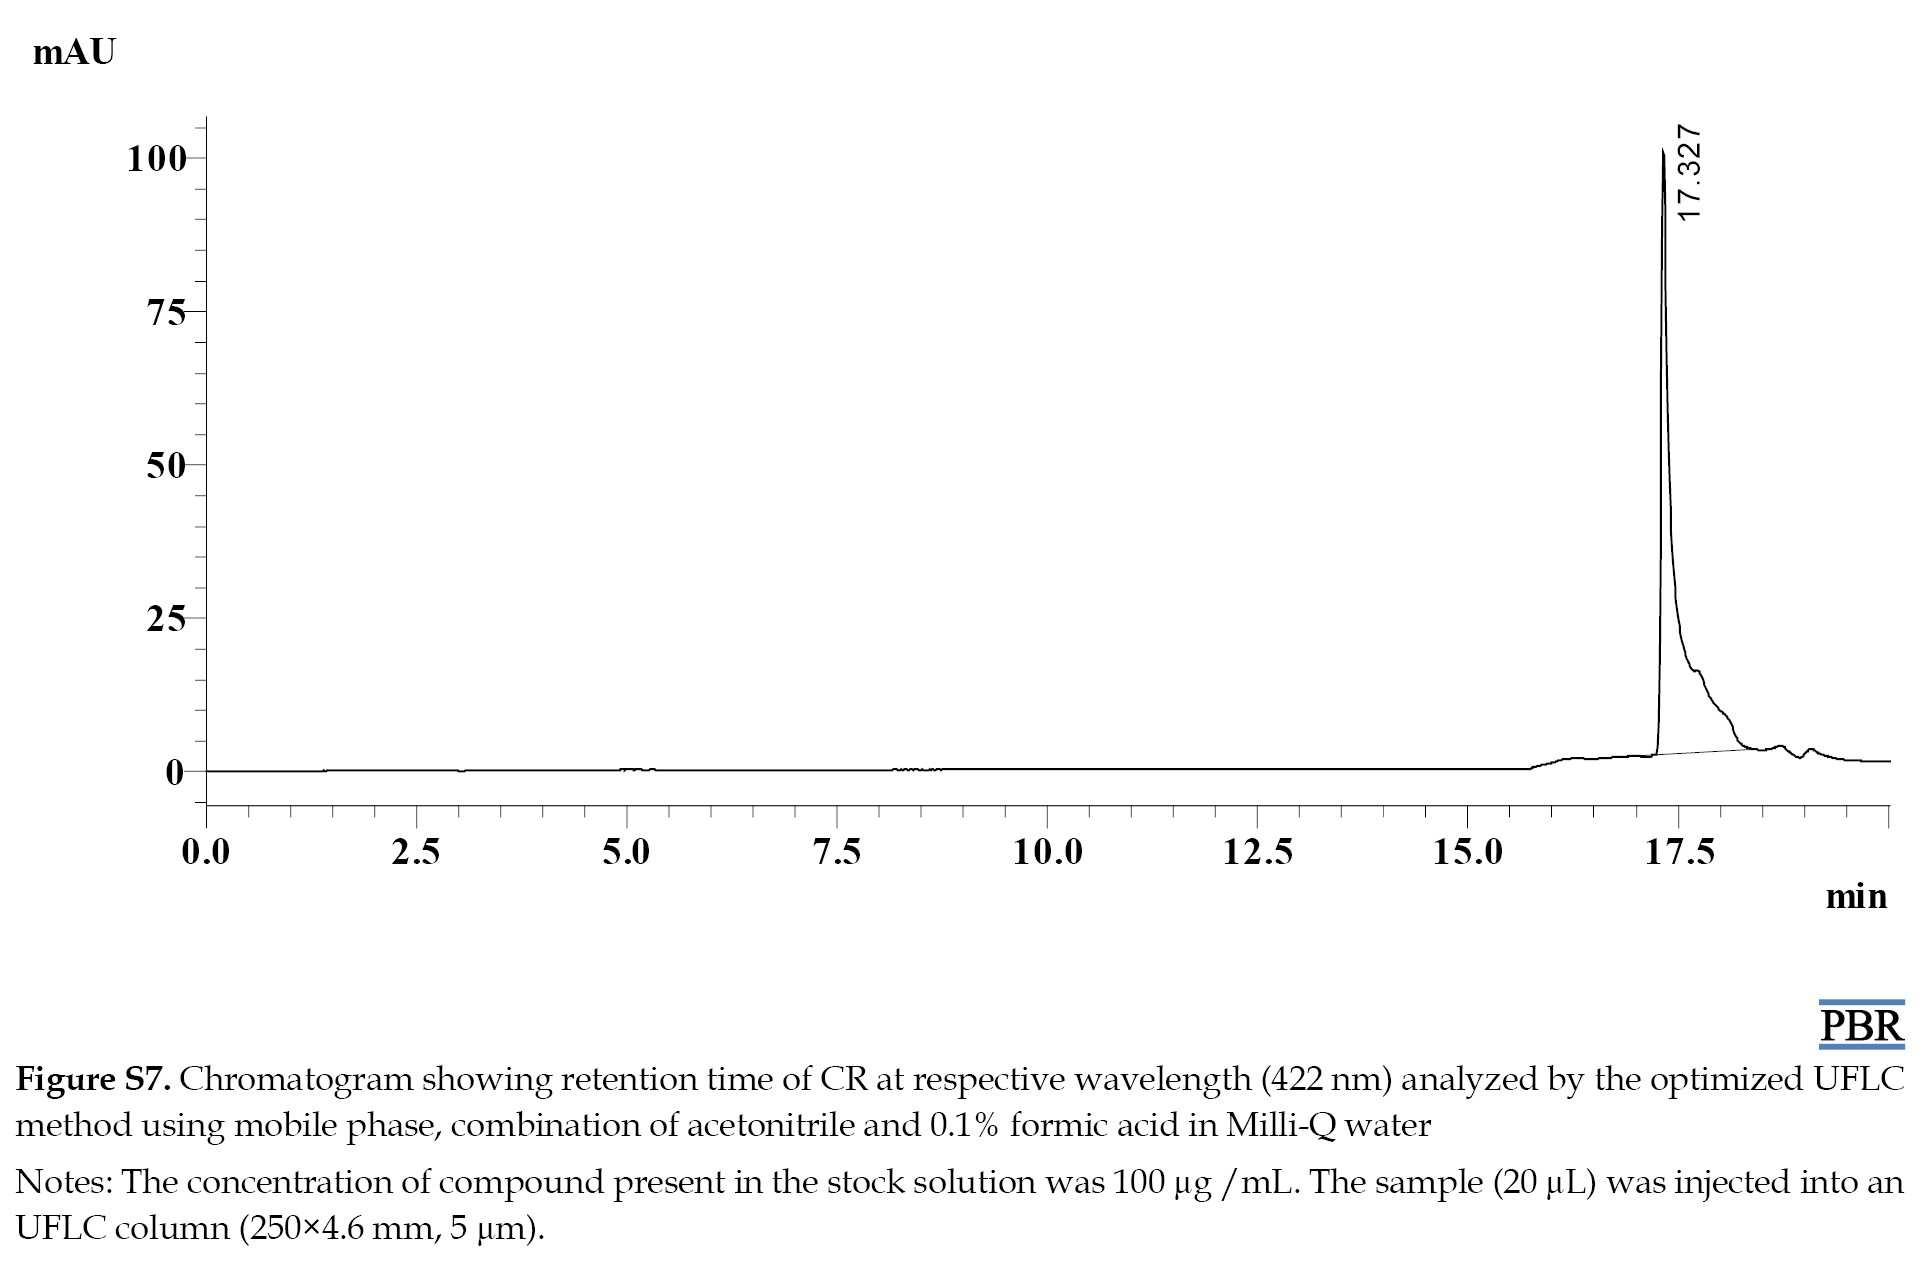
The Rts of MF, RV, SB, CR, and IS were 2.6, 6.3, 8.4, 17.3, and 7.3 min, respectively (Figure S2).
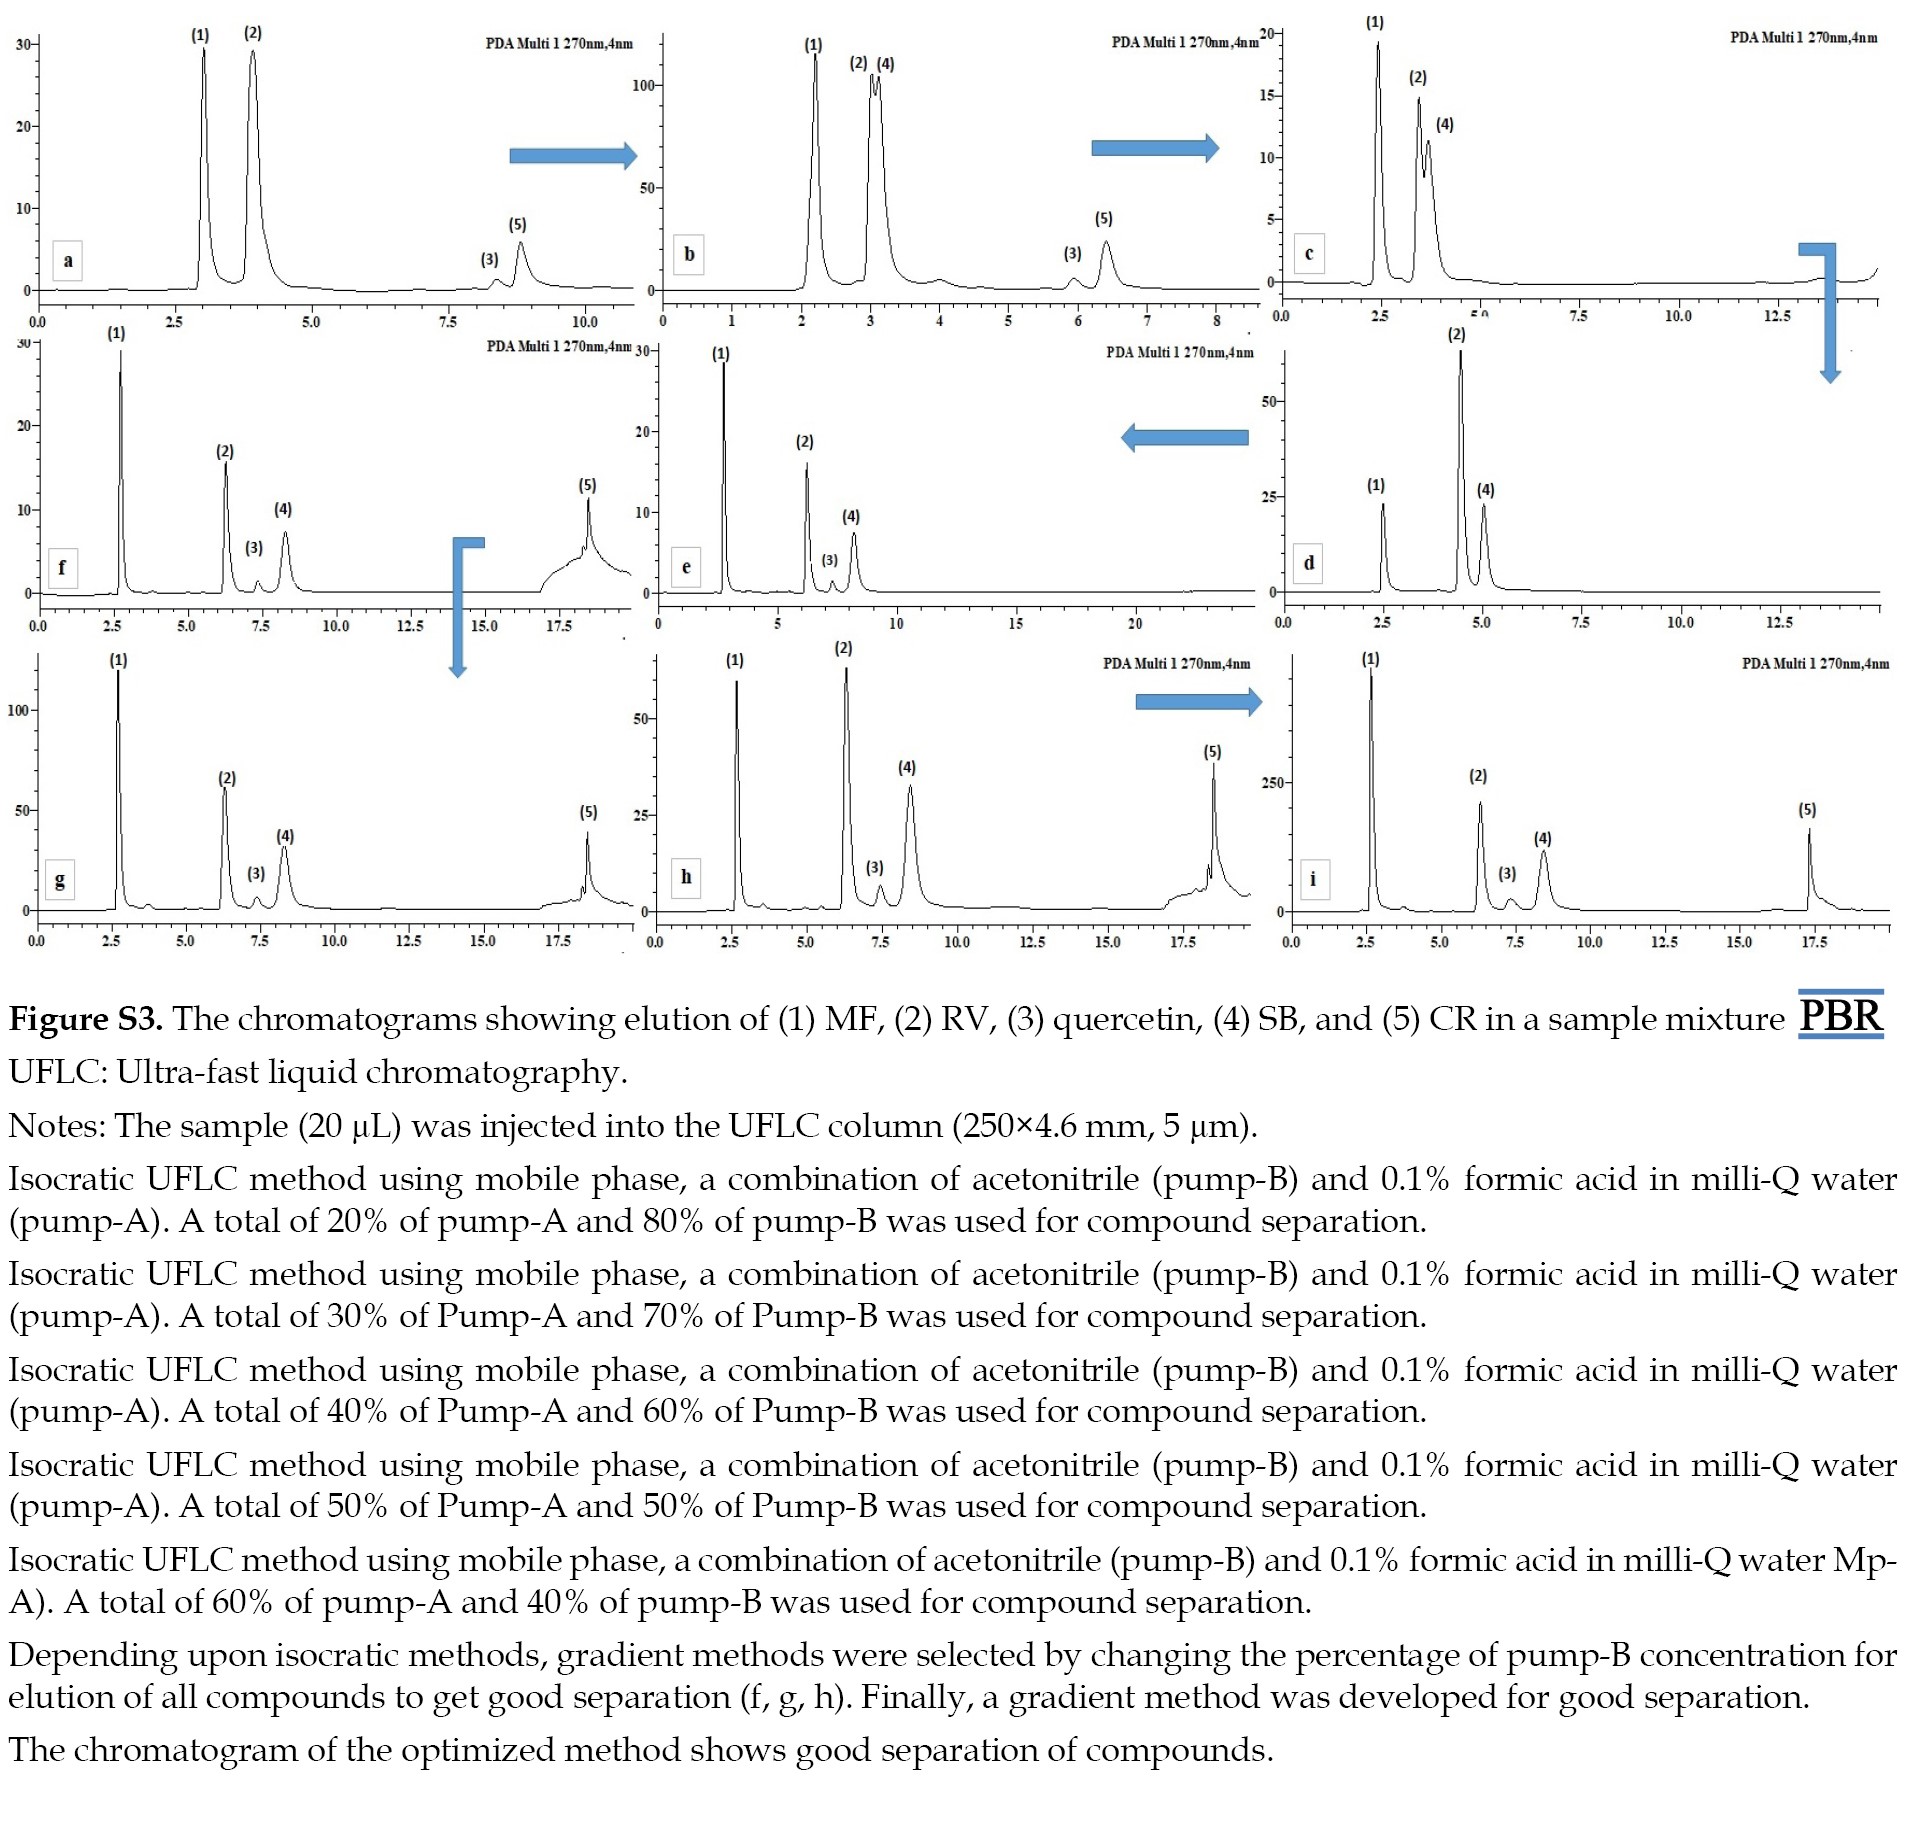
 The effect of the column on the simultaneous separation and determination of MF, RV, SB, CR, and IS peaks was studied with Shimadzu (250×4.6 mm id, 5 µm). This was done by applying a mobile phase of acetonitrile and 0.1% formic acid with pH 3.4 was used as in both isocratic and gradient methods, discussed in detail in the supplementary material (Figure S3).
 The Shimadzu column was used in a gradient method to achieve the most appropriate separation between the peaks, which was discussed in the experimental part. Moreover, the validation of every compound was conducted concurrently using this refined and optimized approach.
Selection of wavelength (λmax)
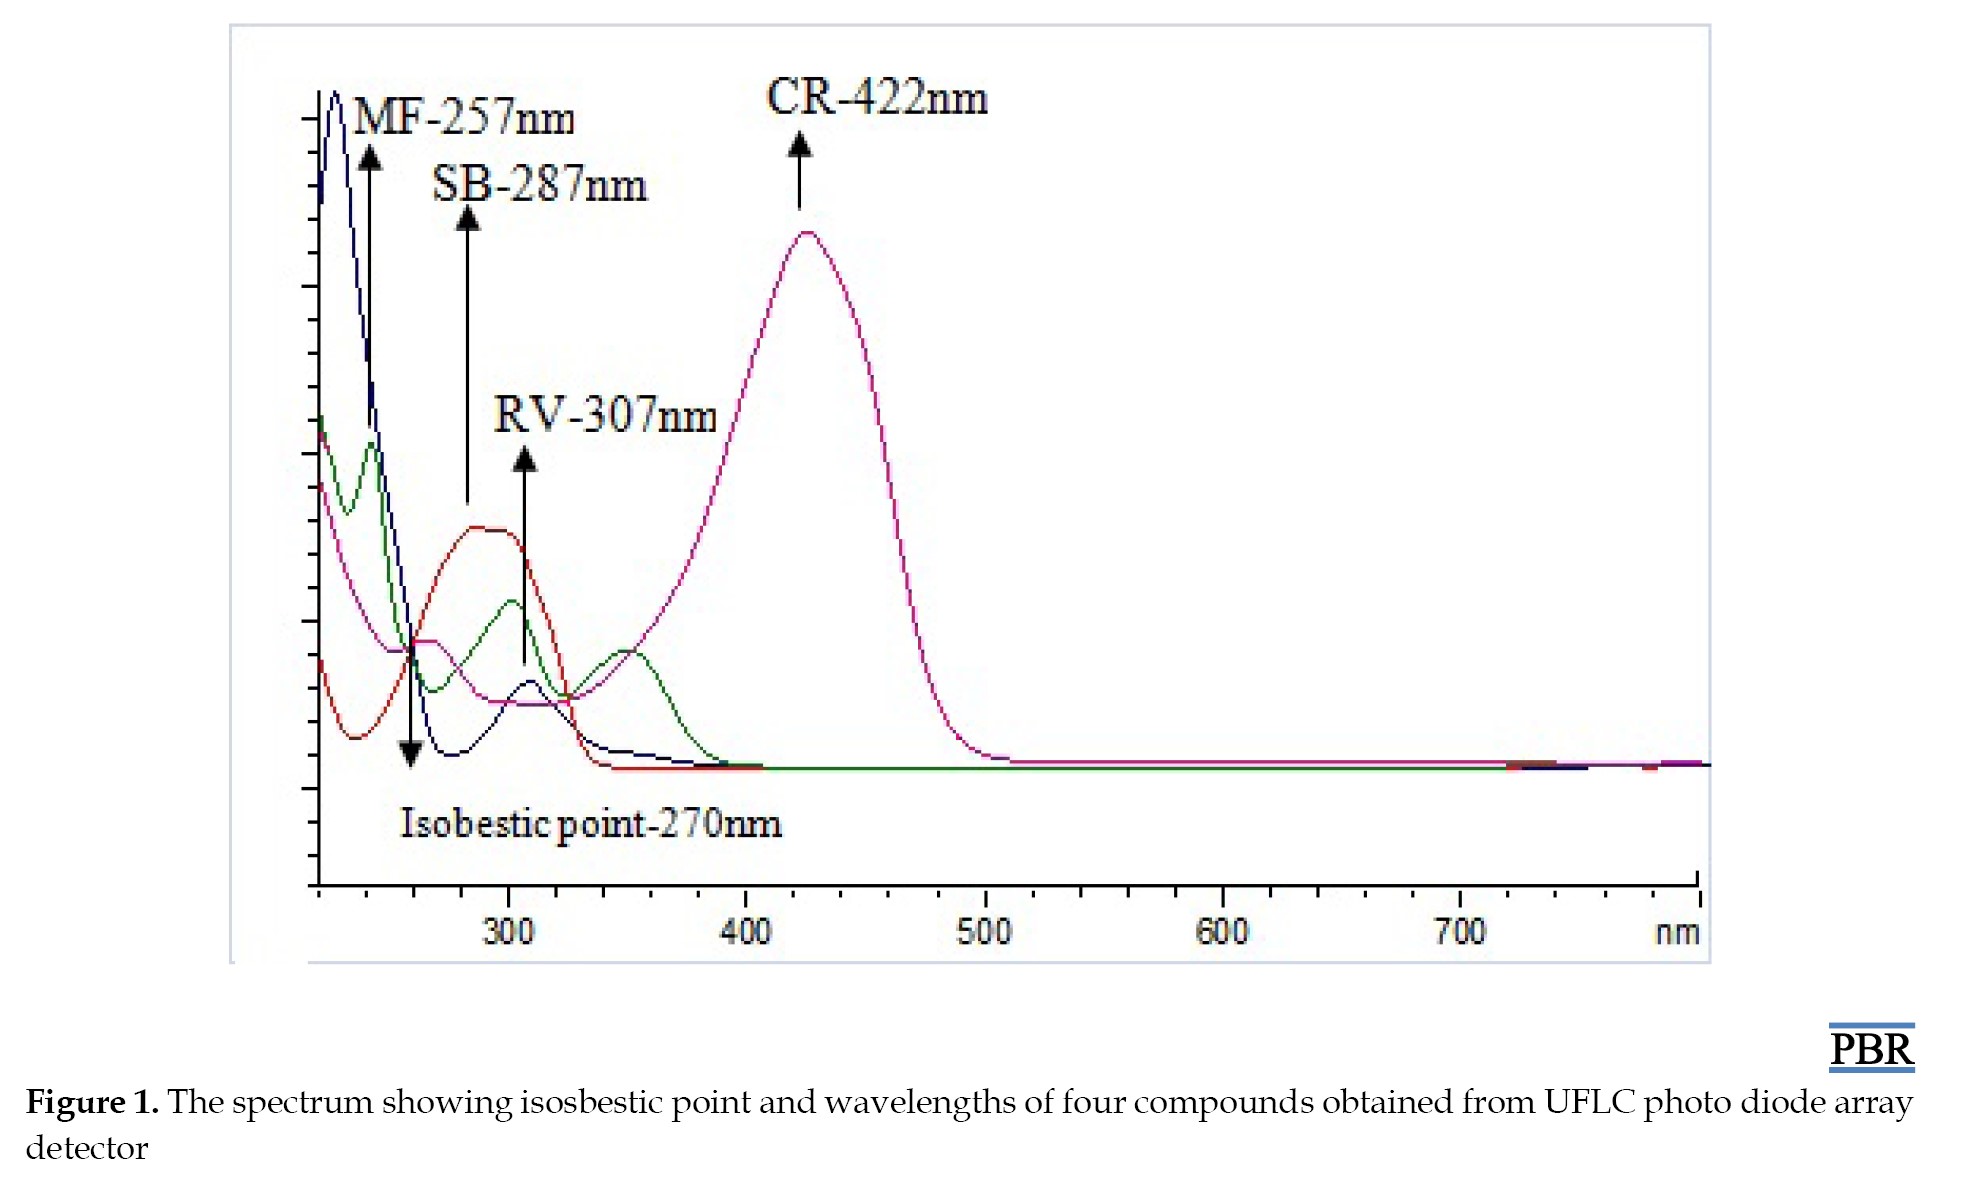
The isobestic point of a combination of compounds was referred to as the wavelength at which the absorption spectra of the compound intersected or overlapped with one another, and was not necessarily related to the specific λmax of any individual compound [18]. In this case, the λmax of MF, RV, SB, CR, and IS were found to be 257, 307, 287, 422, and 294 nm, respectively. The isobestic point of these compounds was 270 nm, which suggested that there was a wavelength at which the absorption spectra of these compounds intersected or overlapped with each other. This could be used as a reference point for determining the concentration of the compounds in a mixture, as shown in (Figure 1).
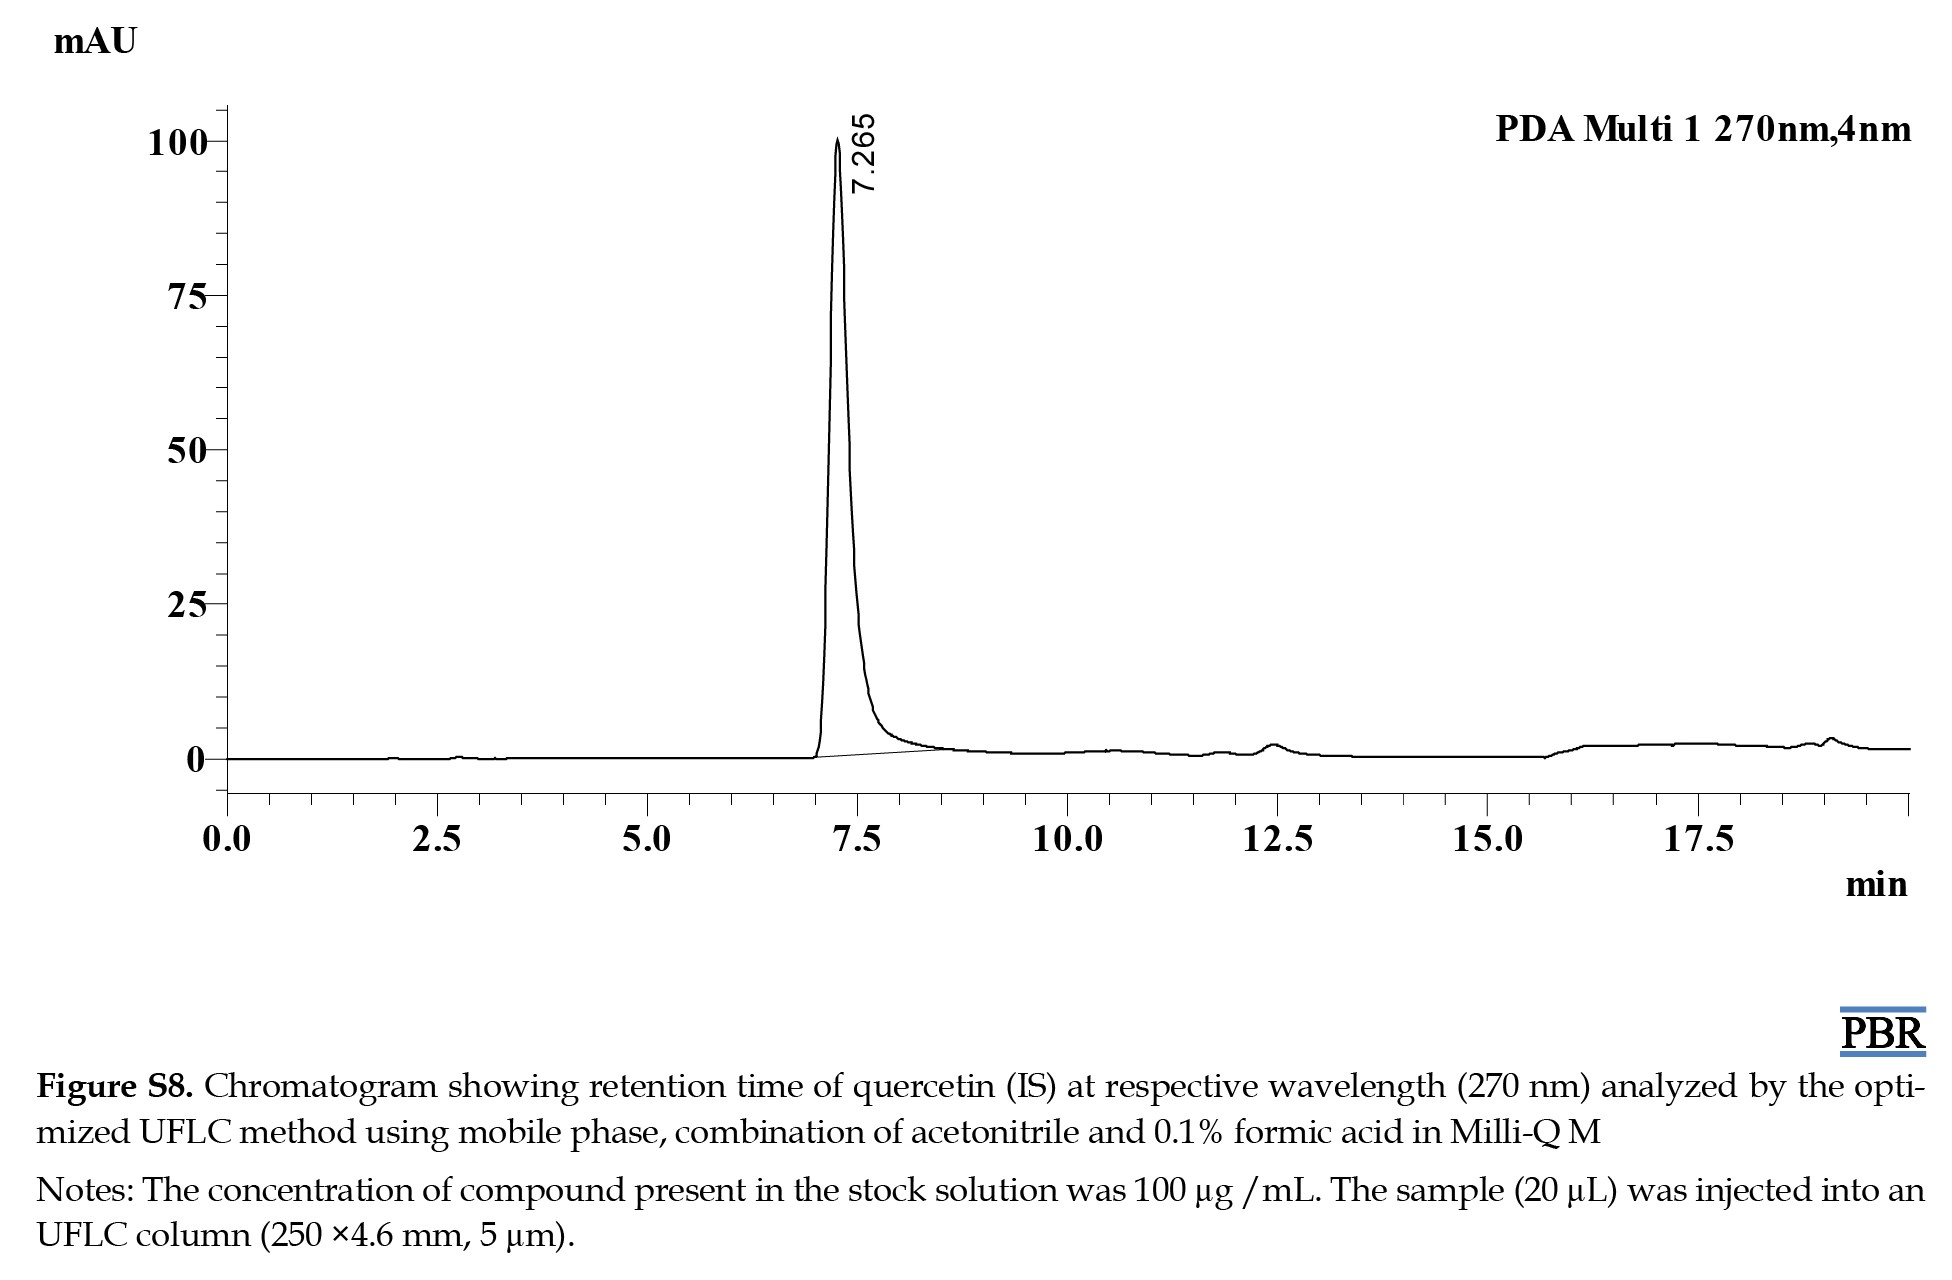
 The individual chromatograms showing the Rts of compounds at their respective wavelengths are given in (Figures S4, S5, S6, S7 and S8).
Linearity
After the standard solutions were injected into the UFLC/PDA system, the peak areas were recorded for each concentration. The results were plotted as a graph of area ratio versus concentration for each analyte. After obtaining a linear regression equation, the correlation coefficient (R2) was computed. As illustrated in Figure 2, the method demonstrated good linearity for each analyte based on the results, with correlation coefficients (R2) greater than or equal to 0.99.
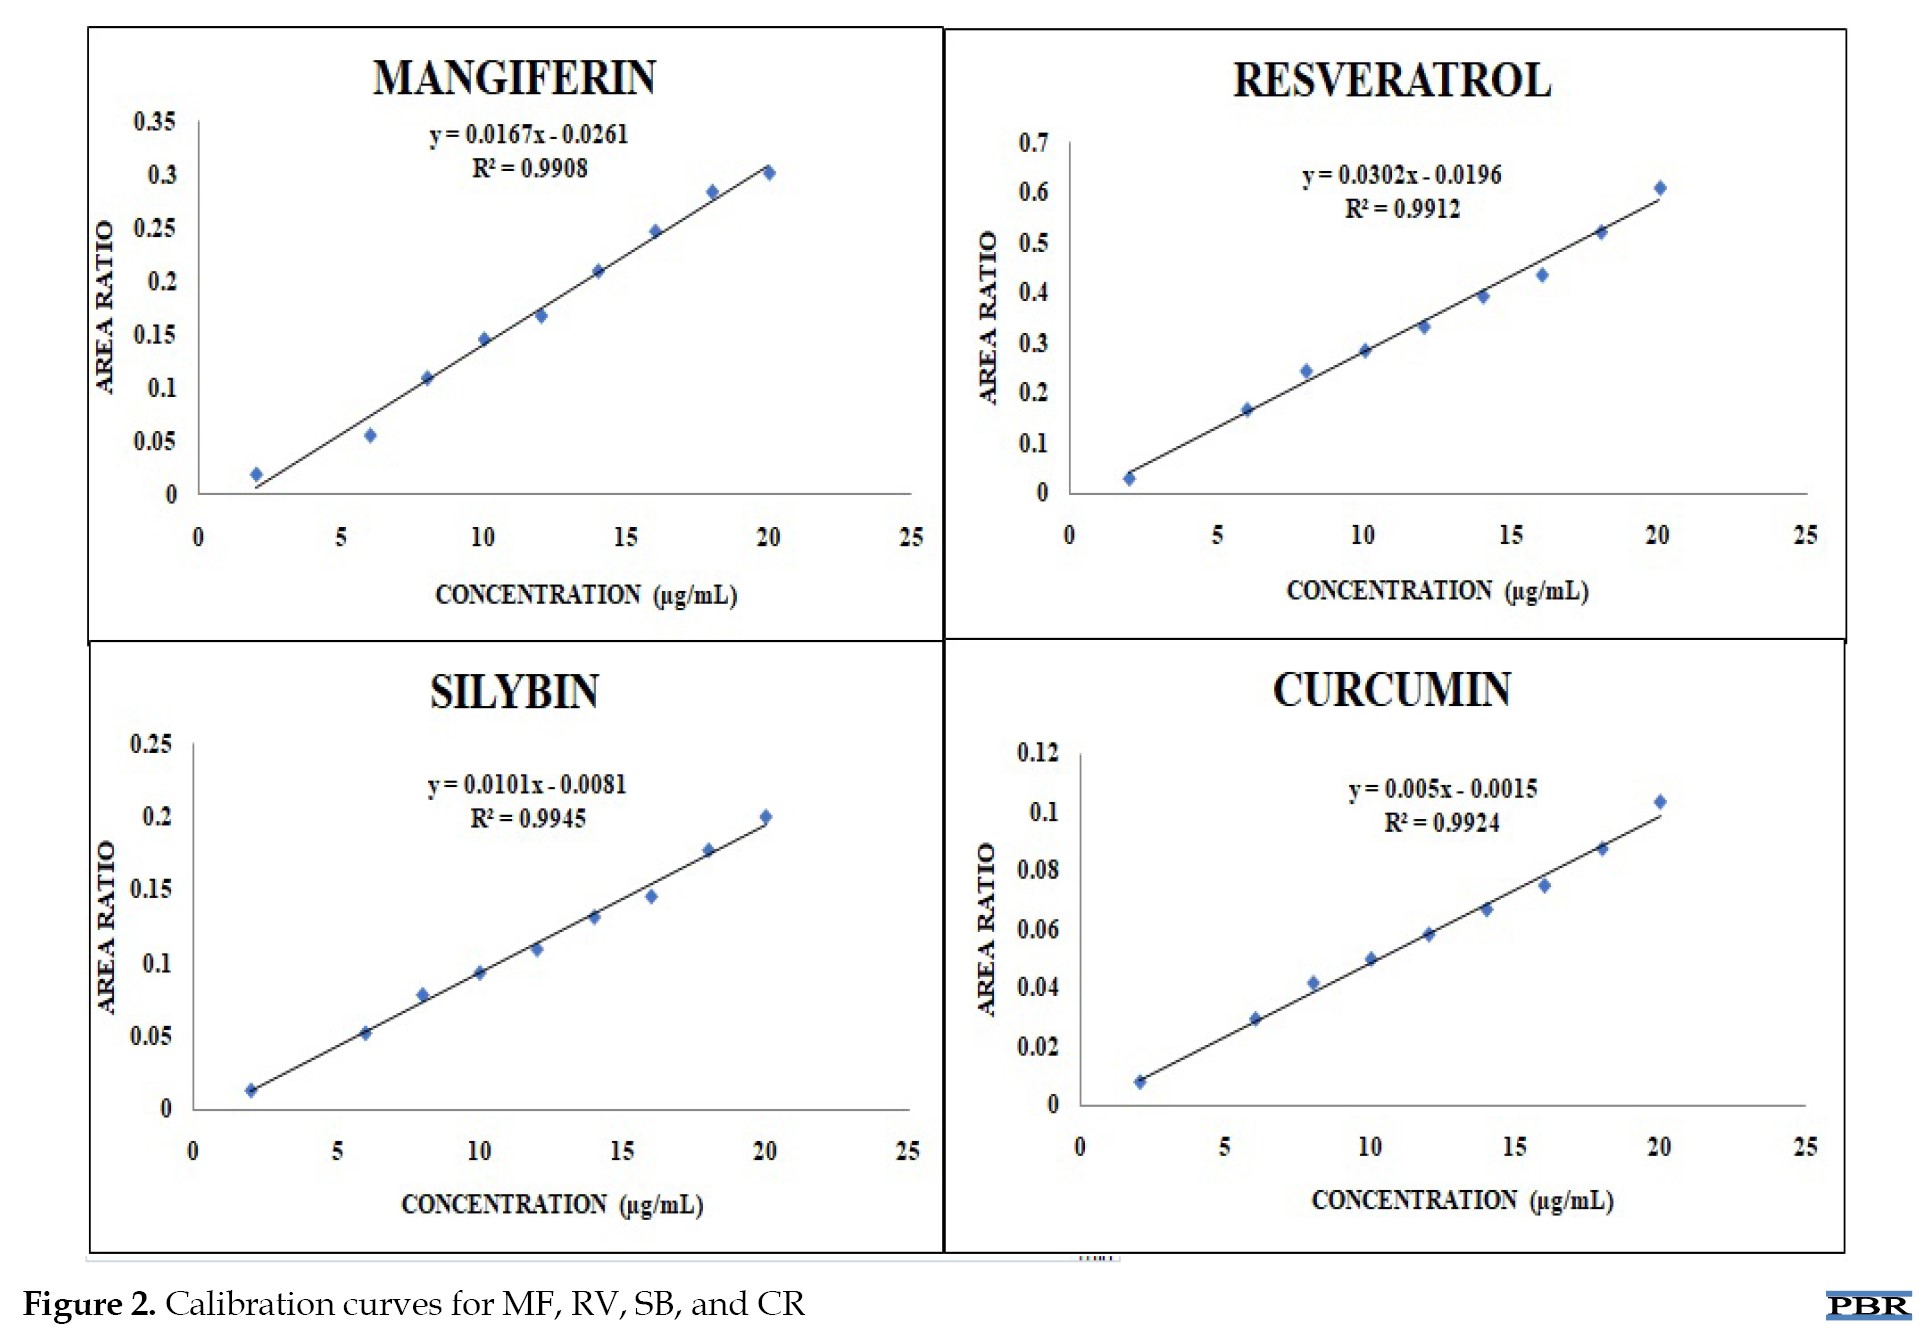 As a result, it was discovered that the UFLC/method was linear and appropriate for quantifying MF, RV, SB, and CR in the test samples.
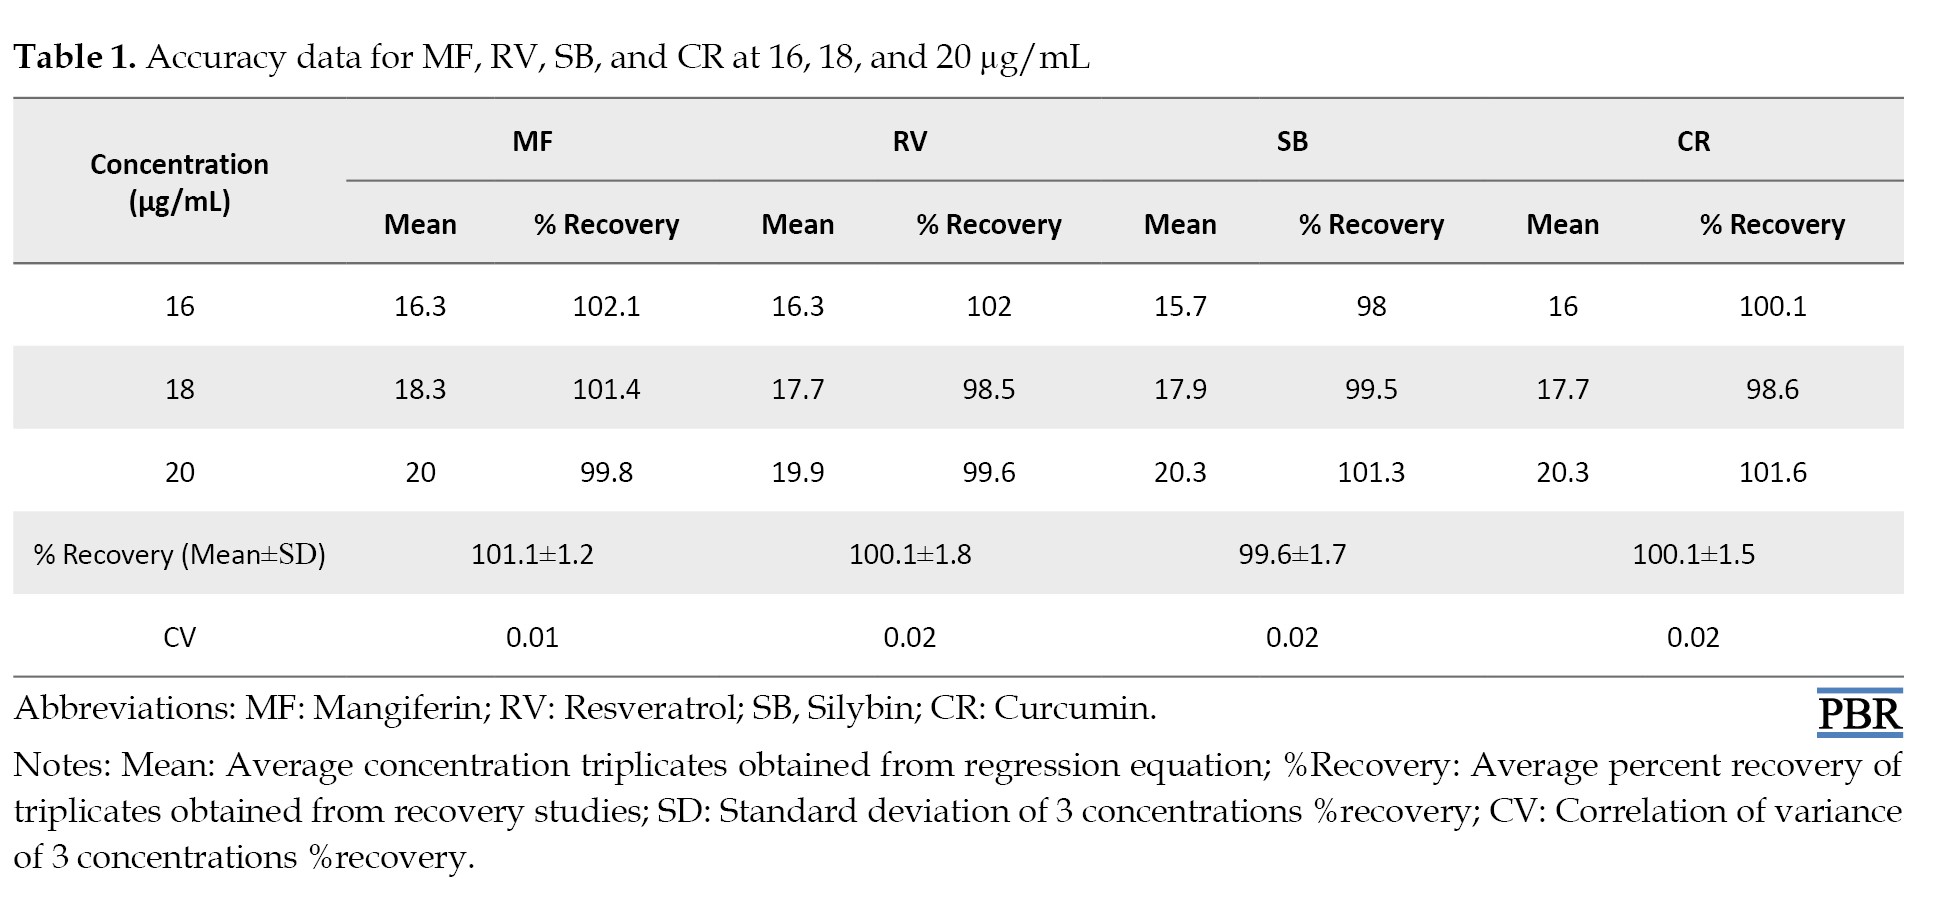
Accuracy
The analytical method’s accuracy was determined by conducting percentage recovery studies. It was measured how well the method could recover the known amount of the analyte from the sample matrix. By comparing the known quantity of sample recovered from the sample using the developed method to the analyte added to the sample, the percentage of recovery was computed. If the percentage recovery fell within an acceptable range, the method was considered to be accurate. In this case, the mean percentage of every compound’s recovery was discovered to be within the range of 98%-102%. Given that the mean percentage recovery was within an acceptable range, this suggests that the developed method was accurate. This is given in Table 1.
Precision
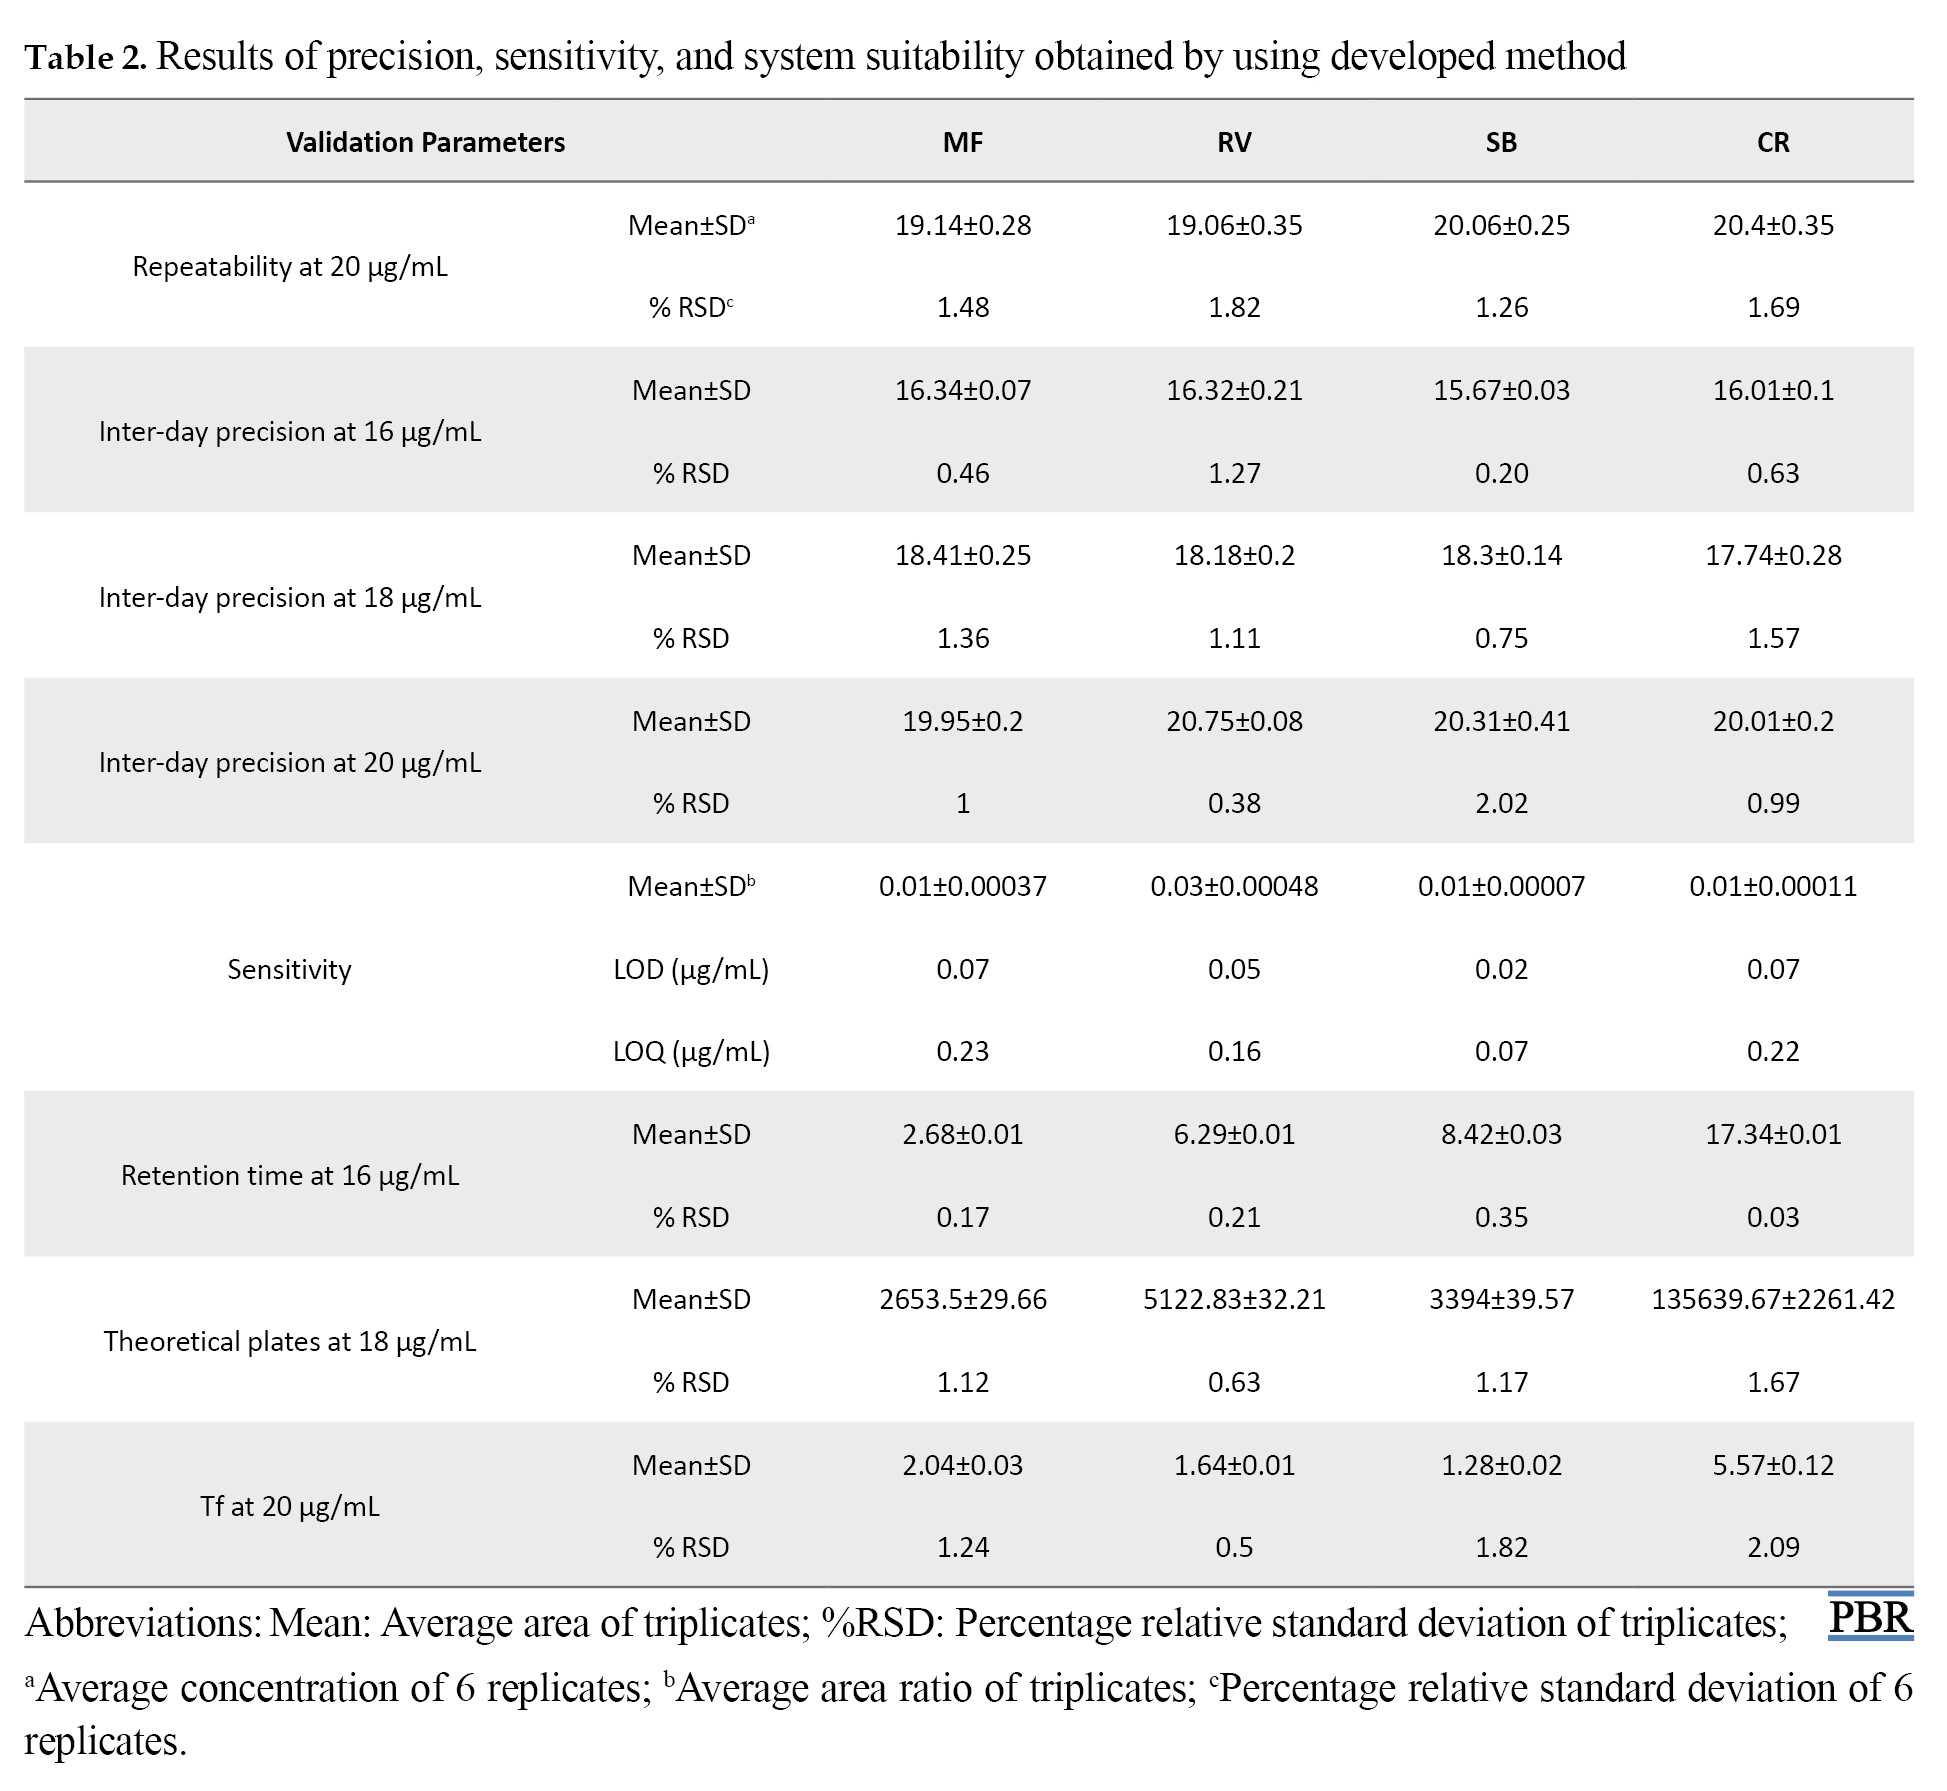
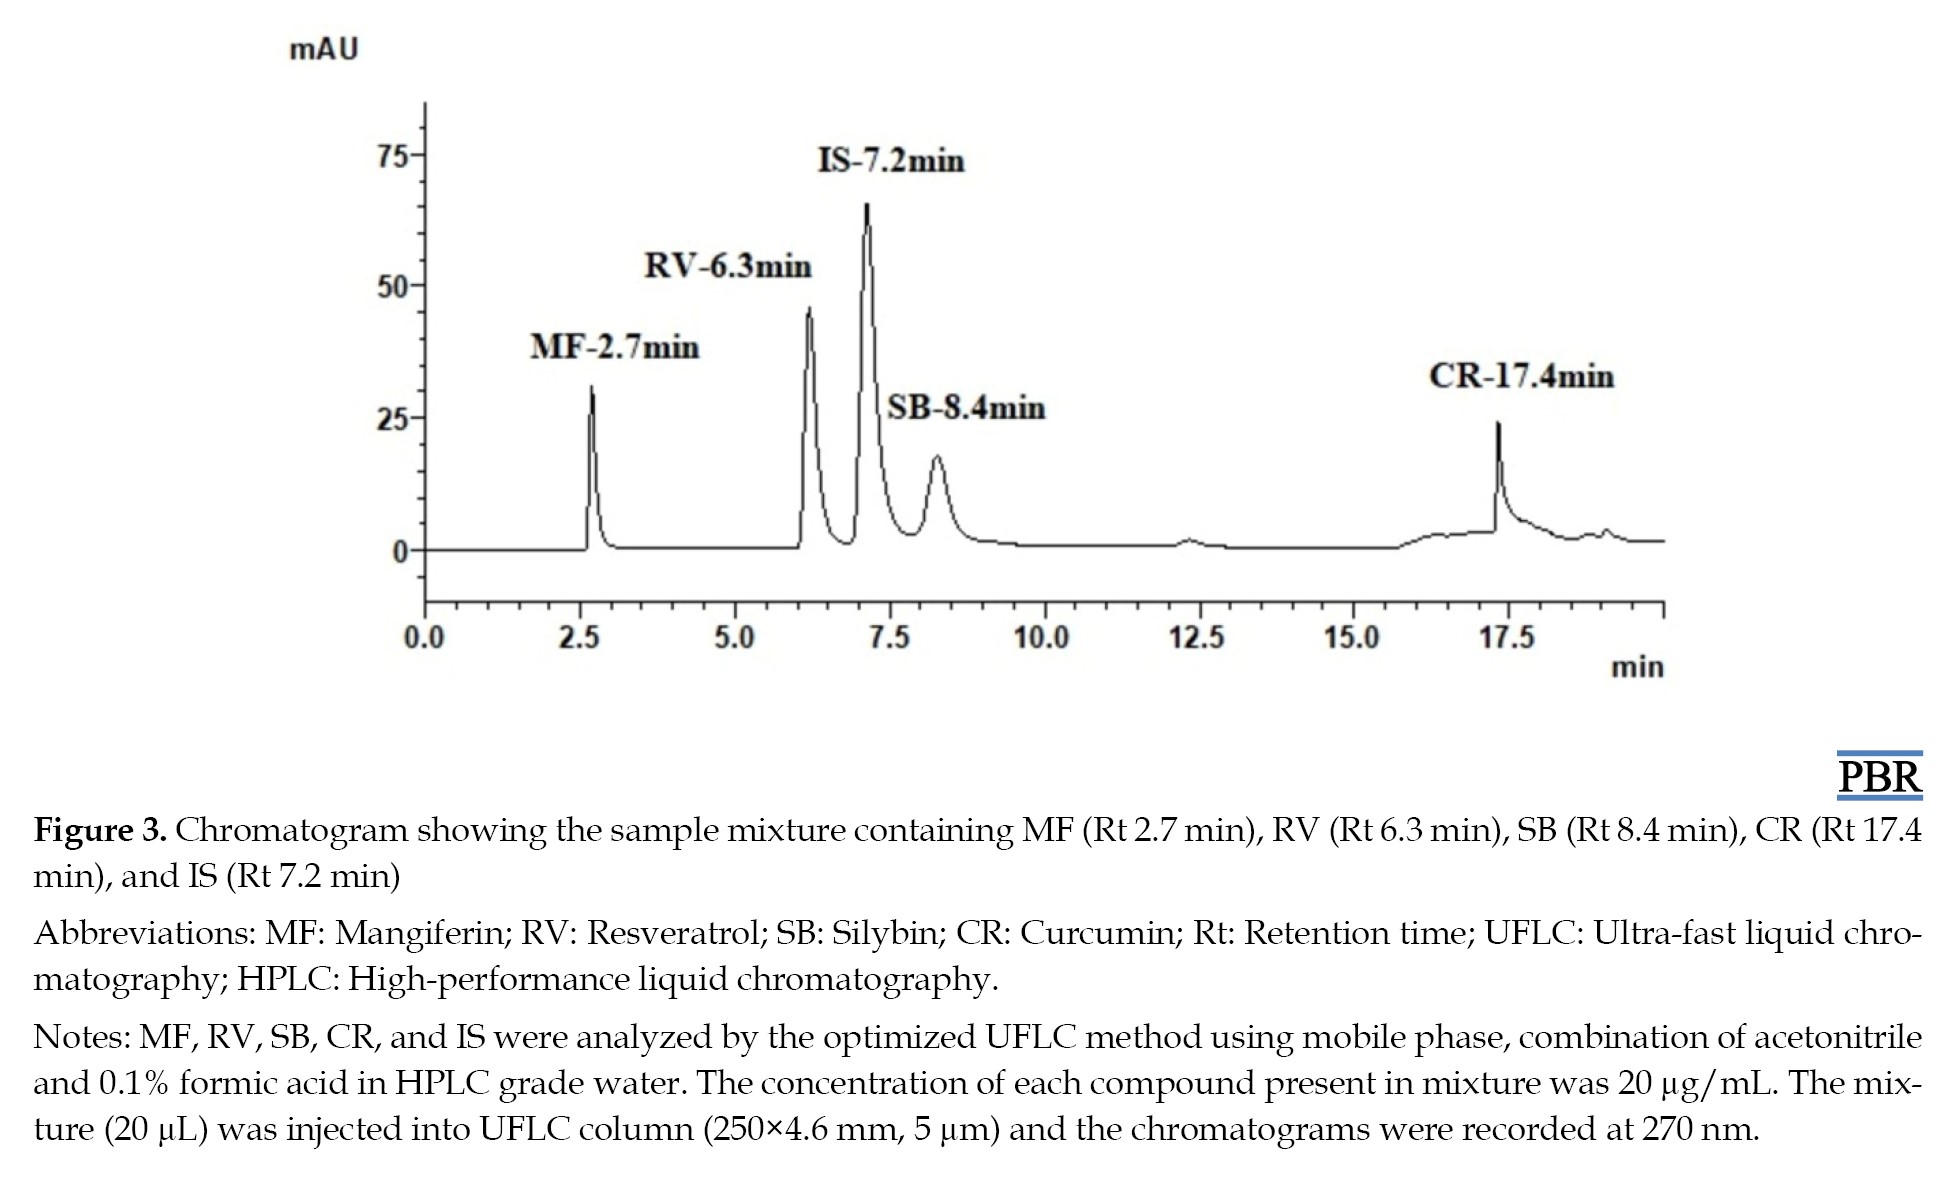
The precision represented the amount of variation between a set of measurements made using several samplings of the same sample carried out following the recommended analytical protocols. To determine precision, intra and inter-day assays were conducted in the current study. The analysis was performed 3 days in a row inside the laboratory to determine Inter-day precision (Intermediate precision) at three concentration levels. The analysis was performed on the same day under the same operating conditions over a brief period to determine Intra-day precision (repeatability). For intra-day precision, the %RSD values of MF, RV, SB, and CR were 1.48, 1.82, 1.26, and 1.69, respectively. In inter-day precision, the %RSD values ranged between 0.46-1.36, 0.38-1.27, 0.75-2.02, and 0.63-1.57 of MF, RV, SB, and CR, respectively. As a result, the %RSD values were found to be less than 2 in both repeatability tests and Intermediate precision studies. This demonstrated the method’s high precision and met the acceptance criteria. Table 2 provided the results, and Figure 3 displayed the repeatability sample’s chromatogram.
Sensitivity
The sensitivity of the developed method was assessed by determining LOD and LOQ for each of the analytes (MF, RV, SB, and CR). A signal-to-noise ratio of three was obtained from the low level of concentration (LOD) of analytes in the sample that were detected but not always quantified. Whereas LOQ was the lowest concentration of analytes which were accurately quantitated and provided a signal-to-noise ratio of 10. In the present study, LOD and LOQ of MF (74.9 and 227 ng/mL), RV (52.4 and 158.9 ng/mL), SB (24.5 and 74.4 ng/mL), and CR (73.7 and 223.5 ng/mL) were found, respectively, and were given in Table 2. The results revealed that the developed method had good sensitivity, as indicated by the low concentrations of LOD and LOQ.
Ruggedness and robustness
Making minor, intentional adjustments to the method’s parameters revealed the method’s robustness and ruggedness, and the result was an accurate and authentic estimation of the drug’s components. To assess robustness, three replicates of a single concentration (20 µg/mL) were injected under chromatographic conditions with different wavelengths (±2) and flow rates (±1). The chromatographic response showed % RSD values <2 and the Rt remained constant, which confirmed the robustness of the optimized method, indicating the reliability of the method during normal usage.
System suitability
Six replicates of system suitability outcomes were obtained, and they revealed that the NTP of MF, RV, SB, and CR ranged between 2620-2705, 5077-5167, 3363-3468, and 133554-139739, respectively, and that %RSD was <2. The %RSD of peak area, Rt, and Tf were <2, <0.35, and 2, respectively, and were within the limits given in Table 2. Therefore, the developed method’s system suitability was confirmed and satisfied, meaning that the optimized method’s parameters were appropriate for sample validation and analysis. The findings show that the chosen system was appropriate for additional MF, RV, SB, and CR validation and analysis.
Selectivity
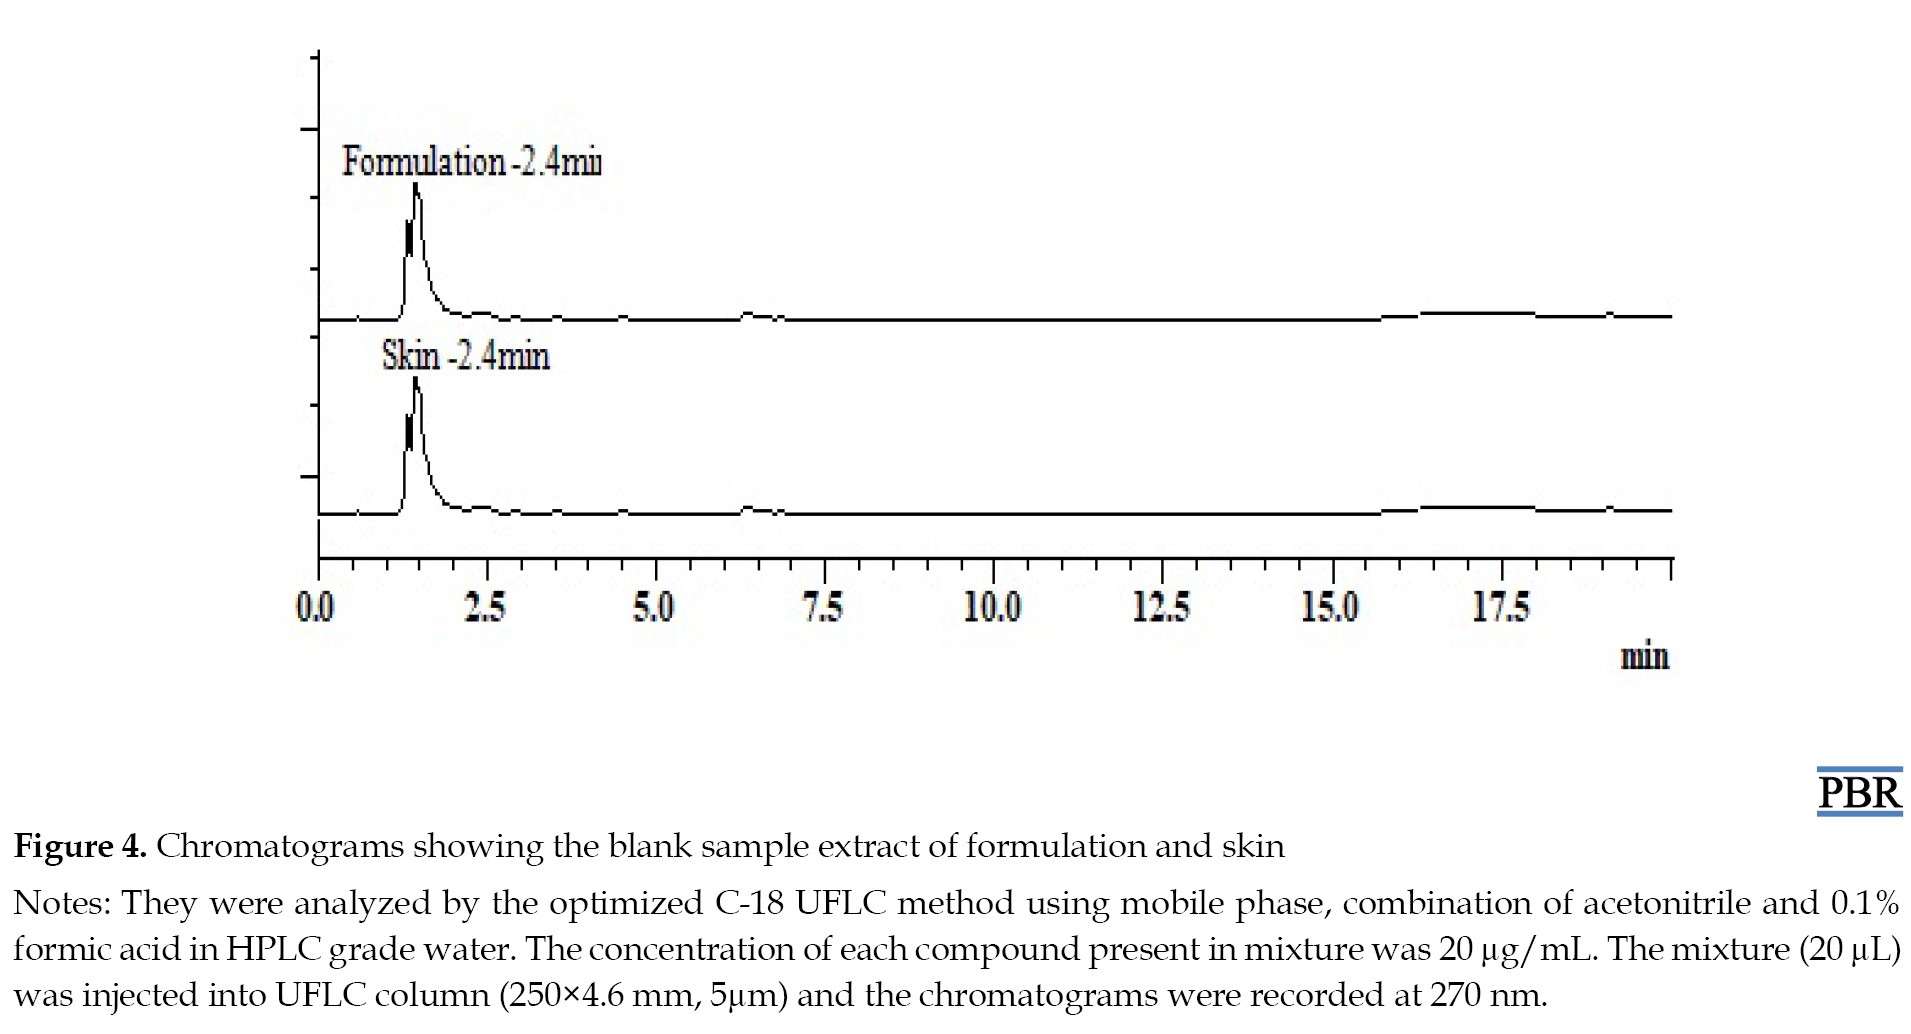
The chromatographic response of repeatedly injected placebo samples indicated that there were no peaks of excipients involved at the Rts of MF, RV, SB, and CR, which demonstrated the selectivity of the method. The chromatograms produced from the drug samples in hydrogel preparation and the placebo samples amply demonstrated this. Chromatograms of both placebo sample extracts of hydrogel and skin are given in Figure 4.
Drug content
The created technique was used to assess the formulation’s homogeneity and drug content. The chromatographic response indicated that all the compounds were uniformly distributed over the prepared formulation. The %drug content of MF, RV, SB, and CR ranged from 93% to 108%.
Ex vivo drug release
The penetration-enhancing effect of capryol-90 on the permeability of MF, RV, SB, and CR across mice skin from a carbopol-based hydrogel system was investigated. The cumulative amount of compounds permeated through mice’s skin from hydrogel formulation at predetermined time points is shown in Figure 5.
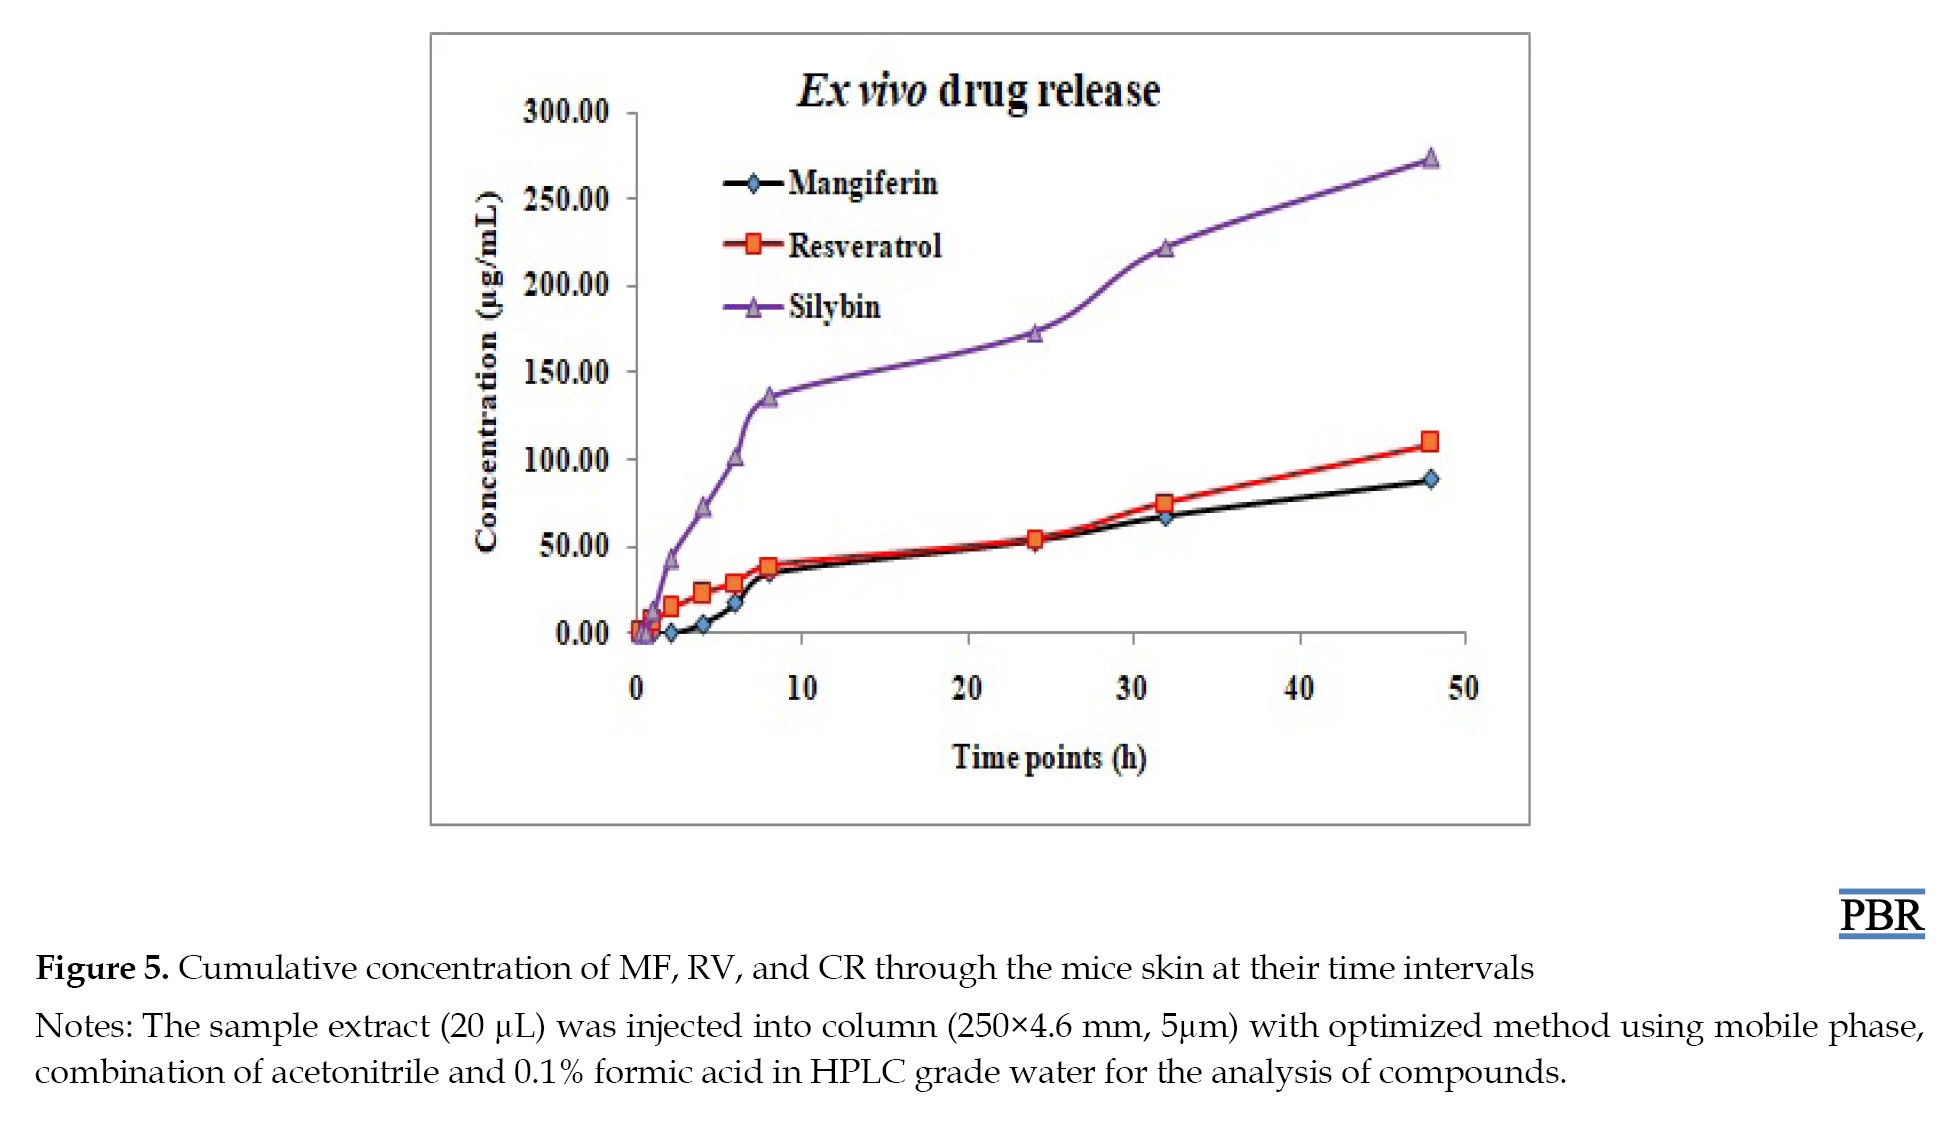 The maximum amounts of MF, RV, and SB that permeated during the 48-h study were 88.29±1.8, 109.53±2.3, and 273.94±3.28 μg per 4.9 cm2 of skin, respectively (Table 3).
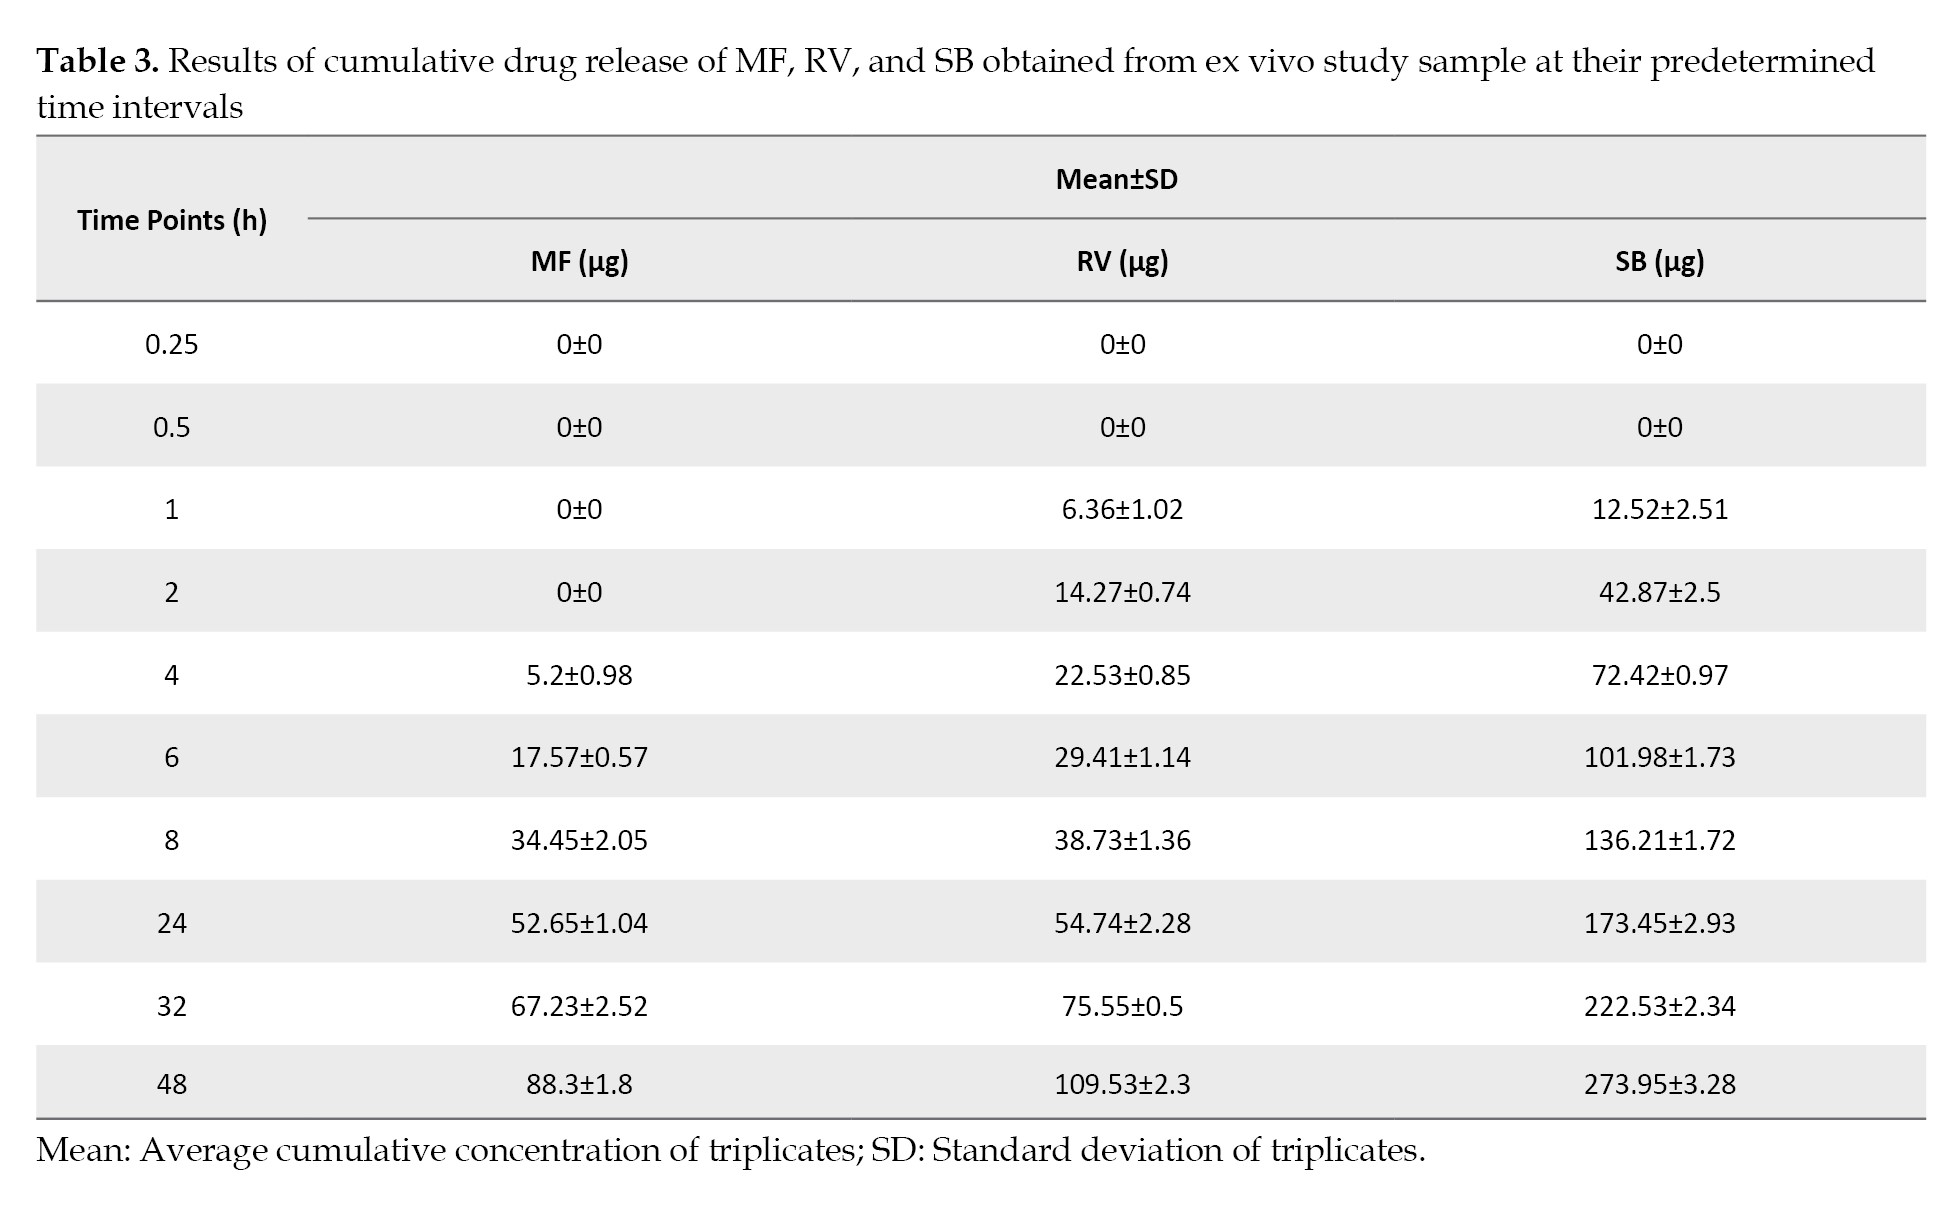
No CR was observed from the prepared formulation throughout the experiment. After completing the study, the remaining gel and skin were removed. The removed gel was extracted with methanol and injected into a system for analysis. The compounds MF, RV, SB, and CR that were available in the remaining gel were 698.28±54.38, 4460.75±128.14, 4424.25±161.4, and 4503.11±103.36 μg per gram of gel, respectively. Furthermore, the skin was also homogenized and extracted with methanol for analysis. The amounts of drug available under the skin for MF, RV, SB, and CR were found to be 200.34±23.15, 456.92±48.03, 257.5±95.75, and 465.31±36.38 μg per 4.9 cm2, respectively, shown in Figure 6.
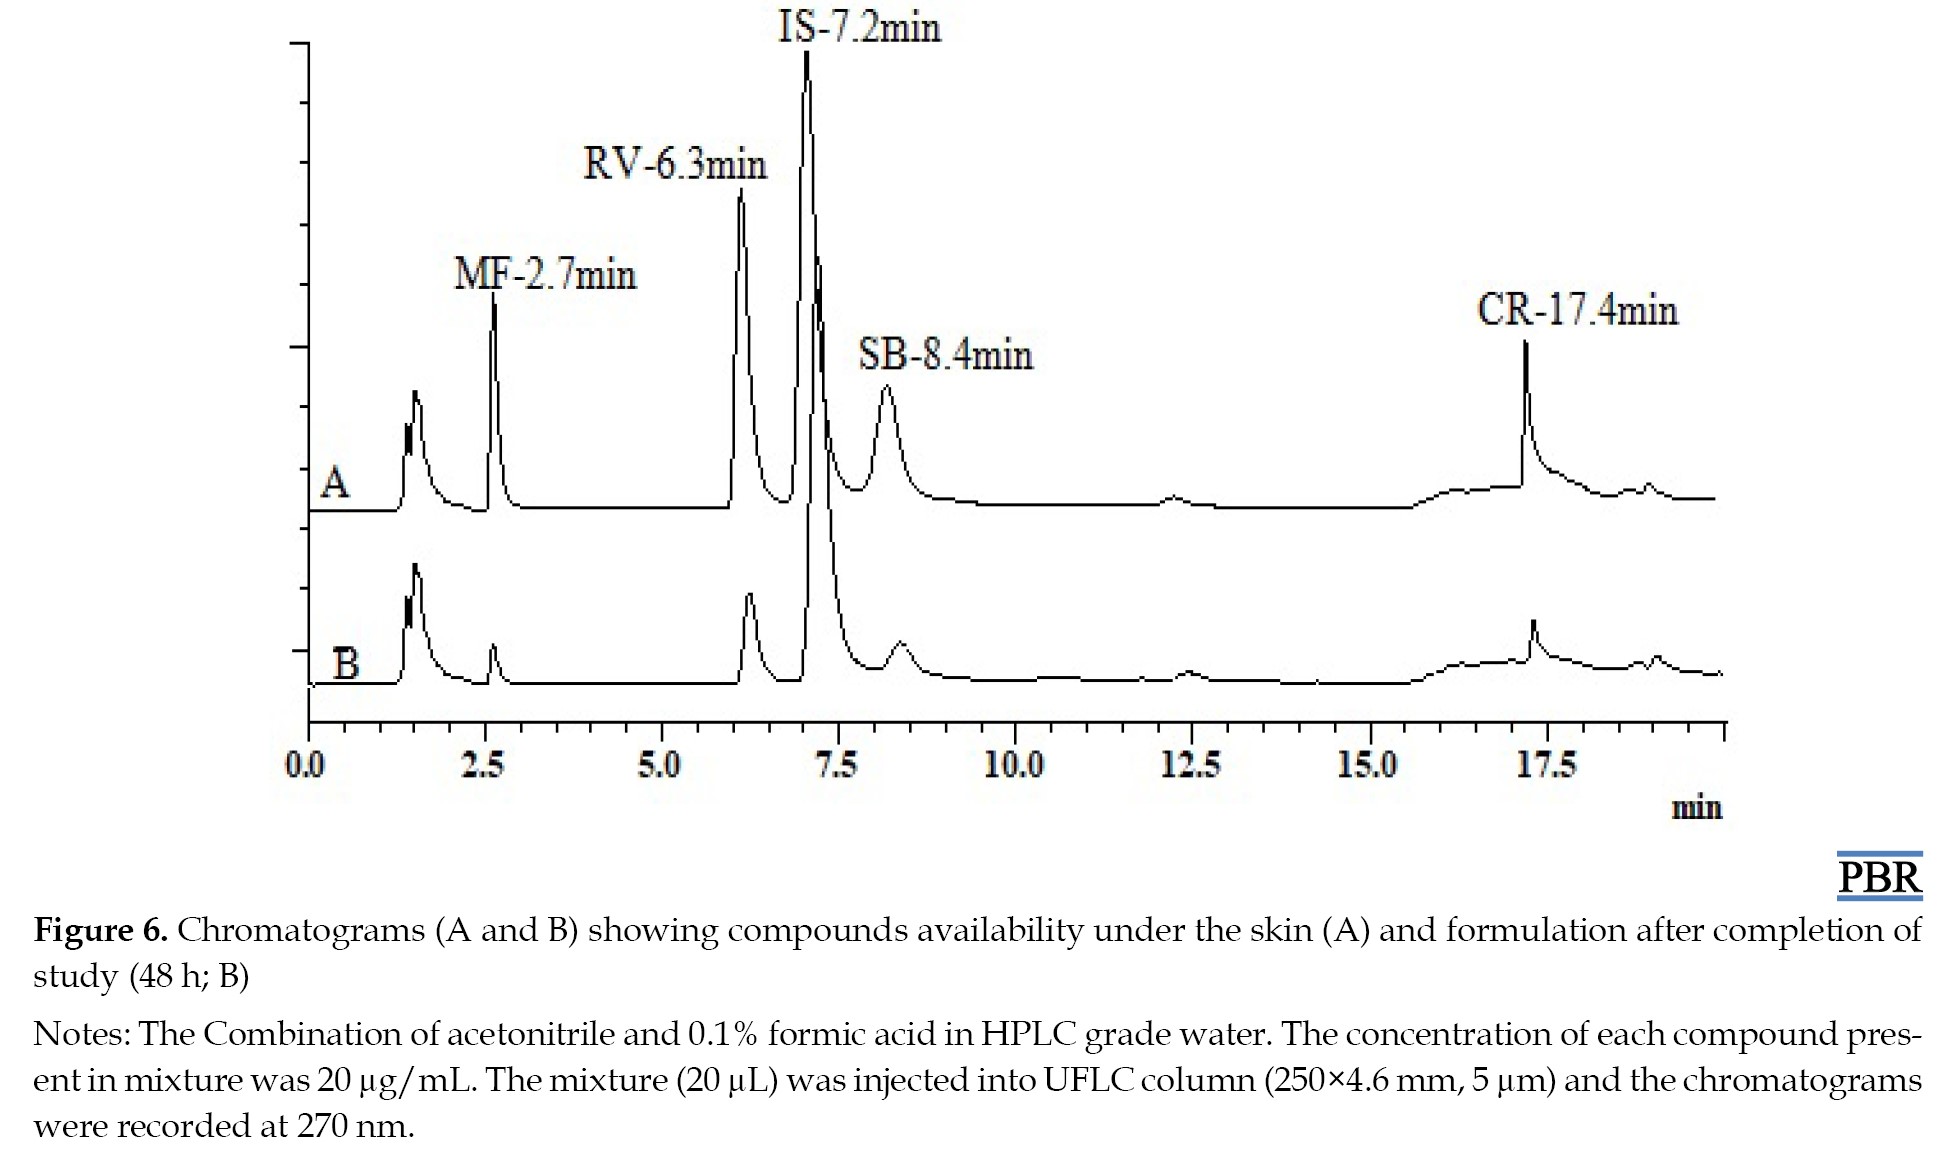 Therefore, each gram of gel contains MF (1000 µg), RV (5000 µg), SB (5000 µg), and CR (5000 µg), respectively. The results confirmed that the drug release through the skin, the content of drug available under the skin, and the amount of drug present in the remaining gel for MF, RV, SB, and CR were 98.74%, 99.50%, 99.16%, and 99.37% of the total amount, respectively.
Conclusion
A novel specific and accurate UFLC/PDA method was strategically developed and optimized. This optimized method was applied for the simultaneous determination of four natural compounds: MF, RV, SB, and CR in the presence of IS in their pure forms, within a hydrogel formulation, and in the skin matrix. Following ICH Q2 (R1) guidelines, the method validation parameters: Linearity, precision, accuracy, sensitivity, selectivity, and system suitability were verified and found to be within permissible limits. Consequently, the method was deemed specific, accurate, precise, and successfully employed for the quantification of MF, RV, SB, and CR in hydrogel to ensure drug content homogeneity. Additionally, this method was applied to determine the concentrations during ex vivo study at different time intervals and the drug retained in the skin after 24 hours. The routine analysis of these four natural compounds can be conducted using this method.
Ethical Considerations
Compliance with ethical guidelines
There were no ethical considerations to be considered in this research.
Funding
This research did not receive any grant from funding agencies in the public, commercial, or non-profit sectors.
Authors' contributions
Conceptualisation and sudy design: Srinivas Maddi; Experiments: Bajee Shaik and Biswajit Swain; Data analysis, and witing the original draft: Bajee Shaik; Review and editing: Eswar Gupta and Srinivas Maddi.
Conflict of interest
The authors declared no conflict of interest.
Acknowledgments
The authors would like to thank the authorities of Acubiosys Private Limited and Krupanidhi College of Pharmacy affiliated with Rajiv Gandhi University of Health Sciences, Bengaluru, India for their support.
References
Mangiferin (MF), resveratrol (RV), silybin (SB), and curcumin (CR) are bioactive compounds found in various plant sources (Mangifera indica L., Vitis vinifera, Silybum marianum, and Curcuma longa, respectively) that have been thoroughly researched for their possible health advantages. These substances have neuroprotective, anti-inflammatory, anticancer, and antioxidant qualities. In terms of its pharmacokinetic properties, these compounds are well tolerated at higher concentrations but they have relatively less bioavailability, which may have been due to poor solubility, low absorption, rapid metabolism, and excretion [1, 2].
The chemical structures are as follows: MF (2-b-D-glucopyranosyl-1,3,6,7-tetrahydroxyxanthone), RV (trans-1,2-(3,4,5-trihydroxydiphenyl)ethylene,3,4,5-trihydroxy-trans-stilbene), SB (2R,3S)-3,5,7-trihydroxy-2-[3-(4-hydroxy-3-methoxyphenyl)-2-(hydroxymethyl)-2,3-dihydro-1,4-benzodioxin-6-yl]-2,3-dihydrochromen-4-one), and CR (E,E)-1,7-Bis(4-hydroxy-3-methoxyphenyl)-1,6-heptadiene-3,5-dione. These structures are shown in Figure S1.
Various techniques for analyzing the MF, RV, SB, and CR both alone and in conjunction with other medications have been documented in the literature. The literature survey indicates that there is currently no existing ultra-fast liquid chromatography (UFLC) technique for the simultaneous estimation of MF, RV, SB, and CR with an internal standard (IS). Consequently, the authors posited that the combined effect of these compounds could be beneficial in managing psoriasis. Accordingly, the current research is designed to develop a novel hydrogel, and a simple, cost-effective, accurate, precise, and validated UFLC method for the quantitative analysis of all samples. There was no marketed formulation combination of MF, RV, SB, and CR in hydrogel or any other dosage form used in medicine. As a result, a fixed-dose combination of hydrogel formulation was developed in the laboratory for the enhancement of topical bioavailability. The formulation incorporated poly-herbal compounds to minimize the complications associated with allopathic medicines. Herbal remedies have become increasingly popular for treating skin conditions.
Materials and Methods
Chemicals, solvents and reagents
MF (97%, CAS: 4773-96-0), RV (99%, CAS: 501-36-0), SB (98%, CAS: 36804-17-8), and CR (natural, CAS: 458-37-7) were purchased from Tokyo Chemical Industry Pvt. Ltd. (Hyderabad, India). Methanol and high-performance liquid chromatography (HPLC)-grade acetonitrile (ACN) were acquired from Merck Life Science Pvt. Ltd., and propylene glycol was purchased from Sigma-Aldrich Chemicals Pvt. Ltd. (Bengaluru, India). Formic acid, carbopol-940, and tri-ethylamine were purchased from Fisher Chemicals. Every chemical and reagent utilized in the investigation was of the highest caliber and purity.
Study instrumentation
An autosampler-mediated (SIL-20AC HT) UFLC (Shimadzu, Japan) equipped with a pump (LC-20AD), and a photodiode array (PDA) detection system (SPD-M20A) was utilized for the chromatographic separation. The oven (CTO-10AS VP), which can hold columns inside the chamber, was used to regulate the temperature of the columns. The Lab Solutions software, VERSION 6.86 SP2 was used for recording and integrating the chromatograms and a calibrated weighing machine (ME204/AD4, Mettler Toledo, Switzerland) was used for weighing all of the standards precisely.
Chromatographic conditions
MF, RV, SB, CR, and IS were separated by chromatography using a Shimadzu (Shim pack solar) C-18 column (250×4.6 mm, 5 µm). The method was devised using a mobile phase made up of 0.1% formic acid (solvent-A) in HPLC grade water and acetonitrile (solvent-B) in a gradient method. Before analysis, the mobile phase underwent a 10-min bath sonication and a 0.45-micron membrane filter with vacuum filtration assembly. The optimal distance between peaks was accomplished by applying solvent-B ranging from 40% over 0.01-11 min, 98% over 11.01-15 min, and maintained at 40% up to 15.01-20 min, at a flow rate of 1 mL/min and a column temperature of 40±0.2 °C keeping injection volume 20 µL.
Stock solution preparation
To create stock solutions, MF, RV, SB, or CR were dissolved in acetonitrile to yield solutions with a 1 mg/mL concentration. Albendazole was dissolved in ACN to create the IS stock solution, which had a 100 µg/mL concentration. The solution was kept at 4 °Ϲ in a refrigerator. A UFLC method was developed and validated, and sample solutions were prepared to investigate ex vivo cumulative percentage drug release.
Method validation
The UFLC/PDA method was validated by adhering to the guidelines set forth by the International Conference on Harmonization. Throughout the project, various validation parameters were examined, such as system suitability, the limit of detection (LOD), the limit of quantification (LOQ), linearity, range, accuracy, and precision [5].
The linearity of the method was evaluated through the injection of nine distinct pure drug standard concentrations, varying from 2 to 20 µg/mL. The proper concentrations of 1 mg/mL stock solution of MF, RV, SB, and [6, 7] were spiked to create the stocks.
Various concentrations, such as 16, 18, and 20 µg/mL of stock solutions containing MF, RV, SB, and CR within the linearity range were prepared. By injecting three identical dilutions of these concentrations into the system, the accuracy of the procedure was ascertained [8, 9].
Precision was evaluated in the form of percentage relative standard deviation (%RSD) between replicates, which must be less than 2%. This assessment was considered as repeatability, intermediate precision, and inter-day precision, To evaluate repeatability, six duplicates of 20 µg/mL stock solutions MF, RV, SB, and CR were injected into the UFLC system on a single day. The intermediate precision of the method was established by injecting three replicates of three concentration levels (16, 18, and 20 µg/mL) over three consecutive days [10, 11].
Three replicates of a single concentration of 2 µg/mL were injected into the UFLC system, and the outcome was noted, in determining the developed method’s sensitivity. The LOD and LOQ were calculated using the regression line equation (Equations 1 and 2) [12].
1. LOD=3.3×(Standard deviation of response)/(Slope of calibration curve)
2. LOQ=10×(Standard deviation of response)/(Slope of calibration curve)
Six injections of a 20 µg/mL stock solution concentration were used to test the system’s suitability. To determine whether the system was suitable, factors including peak area, retention time (Rt), number of theoretical plates (NTP), and tailing factor (Tf) were examined. The acceptance criteria for %RSD of peak area and Rt in replicate injections were <2, and that of Tf was <2. The limit for NTP was >2000, and for height equivalent to a theoretical plate, it was <2 [13].
The developed method’s selectivity was assessed by calculating six placebo hydrogel formulation samples containing all the excipients extracted with methanol. This was examined for any effects of the polymer matrix or formulation-related excipient interference with the drugs [14].
Gel preparation
The 1% gel was prepared by adding accurately weighed carbopol-940 to the required quantity of distilled water and allowing it to soak overnight to form a complete dispersion of the polymer. Triethanolamine was added to the carbopol-940 dispersion while continuously stirring for neutralization, to form an aqueous gel. To this gel, a required quantity of excipients such as 0.1% ethylene diamine tetra acetic acid as a preservative, 1% propylene glycol as an emollient, and 1% capryol-90 as a permeation enhancer were added. On the other hand, a required quantity of active compounds, 0.1% MF, 0.5% RV, 0.5% SB, and 0.5% CR, was added to 10% methanol as a solvent for the formation of an organic dispersion. This organic dispersion was added to the excipients-containing aqueous gel, mixed thoroughly using Remi RQ-121 purchased from Asian Scientific Instruments Hyderabad, to obtain a homogeneous mixture of hydrogel [15].
Sample extraction
The prepared hydrogel was precisely weighed from the tube, and the required quantity of methanol was mixed for the extraction of compounds to achieve concentrations within the linearity range. After centrifuging the mixture for 10 min at 3000 rounds per min (rpm) to ensure maximum retrieval of the sample compound, the mixture was sonicated for 10 min, and the supernatant was then collected [16].
The mice’s skin was removed and weighed accurately, and then chopped into small pieces. Four volumes of phosphate buffer saline at pH 7.4 were added to the mice’s skin, and the mixture was homogenized. To extract the compounds, the required quantity of methanol was added to achieve concentrations within the linearity range and centrifuged at 6000 rpm for around 10 min. The obtained supernatant was isolated and analyzed.
Drug content and homogeneity
The 20 µL of sample extract was injected into the system utilizing the developed method to measure the drug content. The regression equation of the calibration curve was used to determine the percentage of drug content.
Ex vivo drug release
The experiment utilized BLAB/c mice skin, which had already been utilized in standard pharmacological research. Using a scalpel, the non-dermatological skin was cut away, and the full-thickness skin was removed and cleaned with cold tap water. Potassium phosphate buffer (pH 7.4) was poured into the reservoir compartment. Skin with a 4.9 cm2 skin exposure area was sandwiched between the reservoir and donor compartments of the Franz diffusion cell. Meanwhile, 1 g of the formulation was applied to the skin-facing donor compartment. The apparatus was kept on continuous stirring and the temperature of 37±2 °C was maintained throughout the experiment. To maintain sink condition, 1 mL of sample was taken from the receptor compartment at predefined intervals (0.083, 0.25, 0.5, 1, 2, 4, 8, and 24 h) and replaced with an equal volume of fresh buffer solution. Regression equations derived from the standard graph were utilized to compute the percentage cumulative drug release from the formulation [17].
Results and Discussion
Optimization of chromatographic conditions
The Rts of MF, RV, SB, CR, and IS were 2.6, 6.3, 8.4, 17.3, and 7.3 min, respectively (Figure S2).
Selection of wavelength (λmax)
The isobestic point of a combination of compounds was referred to as the wavelength at which the absorption spectra of the compound intersected or overlapped with one another, and was not necessarily related to the specific λmax of any individual compound [18]. In this case, the λmax of MF, RV, SB, CR, and IS were found to be 257, 307, 287, 422, and 294 nm, respectively. The isobestic point of these compounds was 270 nm, which suggested that there was a wavelength at which the absorption spectra of these compounds intersected or overlapped with each other. This could be used as a reference point for determining the concentration of the compounds in a mixture, as shown in (Figure 1).
Linearity
After the standard solutions were injected into the UFLC/PDA system, the peak areas were recorded for each concentration. The results were plotted as a graph of area ratio versus concentration for each analyte. After obtaining a linear regression equation, the correlation coefficient (R2) was computed. As illustrated in Figure 2, the method demonstrated good linearity for each analyte based on the results, with correlation coefficients (R2) greater than or equal to 0.99.
Accuracy
The analytical method’s accuracy was determined by conducting percentage recovery studies. It was measured how well the method could recover the known amount of the analyte from the sample matrix. By comparing the known quantity of sample recovered from the sample using the developed method to the analyte added to the sample, the percentage of recovery was computed. If the percentage recovery fell within an acceptable range, the method was considered to be accurate. In this case, the mean percentage of every compound’s recovery was discovered to be within the range of 98%-102%. Given that the mean percentage recovery was within an acceptable range, this suggests that the developed method was accurate. This is given in Table 1.
Precision
The precision represented the amount of variation between a set of measurements made using several samplings of the same sample carried out following the recommended analytical protocols. To determine precision, intra and inter-day assays were conducted in the current study. The analysis was performed 3 days in a row inside the laboratory to determine Inter-day precision (Intermediate precision) at three concentration levels. The analysis was performed on the same day under the same operating conditions over a brief period to determine Intra-day precision (repeatability). For intra-day precision, the %RSD values of MF, RV, SB, and CR were 1.48, 1.82, 1.26, and 1.69, respectively. In inter-day precision, the %RSD values ranged between 0.46-1.36, 0.38-1.27, 0.75-2.02, and 0.63-1.57 of MF, RV, SB, and CR, respectively. As a result, the %RSD values were found to be less than 2 in both repeatability tests and Intermediate precision studies. This demonstrated the method’s high precision and met the acceptance criteria. Table 2 provided the results, and Figure 3 displayed the repeatability sample’s chromatogram.
Sensitivity
The sensitivity of the developed method was assessed by determining LOD and LOQ for each of the analytes (MF, RV, SB, and CR). A signal-to-noise ratio of three was obtained from the low level of concentration (LOD) of analytes in the sample that were detected but not always quantified. Whereas LOQ was the lowest concentration of analytes which were accurately quantitated and provided a signal-to-noise ratio of 10. In the present study, LOD and LOQ of MF (74.9 and 227 ng/mL), RV (52.4 and 158.9 ng/mL), SB (24.5 and 74.4 ng/mL), and CR (73.7 and 223.5 ng/mL) were found, respectively, and were given in Table 2. The results revealed that the developed method had good sensitivity, as indicated by the low concentrations of LOD and LOQ.
Ruggedness and robustness
Making minor, intentional adjustments to the method’s parameters revealed the method’s robustness and ruggedness, and the result was an accurate and authentic estimation of the drug’s components. To assess robustness, three replicates of a single concentration (20 µg/mL) were injected under chromatographic conditions with different wavelengths (±2) and flow rates (±1). The chromatographic response showed % RSD values <2 and the Rt remained constant, which confirmed the robustness of the optimized method, indicating the reliability of the method during normal usage.
System suitability
Six replicates of system suitability outcomes were obtained, and they revealed that the NTP of MF, RV, SB, and CR ranged between 2620-2705, 5077-5167, 3363-3468, and 133554-139739, respectively, and that %RSD was <2. The %RSD of peak area, Rt, and Tf were <2, <0.35, and 2, respectively, and were within the limits given in Table 2. Therefore, the developed method’s system suitability was confirmed and satisfied, meaning that the optimized method’s parameters were appropriate for sample validation and analysis. The findings show that the chosen system was appropriate for additional MF, RV, SB, and CR validation and analysis.
Selectivity
The chromatographic response of repeatedly injected placebo samples indicated that there were no peaks of excipients involved at the Rts of MF, RV, SB, and CR, which demonstrated the selectivity of the method. The chromatograms produced from the drug samples in hydrogel preparation and the placebo samples amply demonstrated this. Chromatograms of both placebo sample extracts of hydrogel and skin are given in Figure 4.
Drug content
The created technique was used to assess the formulation’s homogeneity and drug content. The chromatographic response indicated that all the compounds were uniformly distributed over the prepared formulation. The %drug content of MF, RV, SB, and CR ranged from 93% to 108%.
Ex vivo drug release
The penetration-enhancing effect of capryol-90 on the permeability of MF, RV, SB, and CR across mice skin from a carbopol-based hydrogel system was investigated. The cumulative amount of compounds permeated through mice’s skin from hydrogel formulation at predetermined time points is shown in Figure 5.
No CR was observed from the prepared formulation throughout the experiment. After completing the study, the remaining gel and skin were removed. The removed gel was extracted with methanol and injected into a system for analysis. The compounds MF, RV, SB, and CR that were available in the remaining gel were 698.28±54.38, 4460.75±128.14, 4424.25±161.4, and 4503.11±103.36 μg per gram of gel, respectively. Furthermore, the skin was also homogenized and extracted with methanol for analysis. The amounts of drug available under the skin for MF, RV, SB, and CR were found to be 200.34±23.15, 456.92±48.03, 257.5±95.75, and 465.31±36.38 μg per 4.9 cm2, respectively, shown in Figure 6.
Conclusion
A novel specific and accurate UFLC/PDA method was strategically developed and optimized. This optimized method was applied for the simultaneous determination of four natural compounds: MF, RV, SB, and CR in the presence of IS in their pure forms, within a hydrogel formulation, and in the skin matrix. Following ICH Q2 (R1) guidelines, the method validation parameters: Linearity, precision, accuracy, sensitivity, selectivity, and system suitability were verified and found to be within permissible limits. Consequently, the method was deemed specific, accurate, precise, and successfully employed for the quantification of MF, RV, SB, and CR in hydrogel to ensure drug content homogeneity. Additionally, this method was applied to determine the concentrations during ex vivo study at different time intervals and the drug retained in the skin after 24 hours. The routine analysis of these four natural compounds can be conducted using this method.
Ethical Considerations
Compliance with ethical guidelines
There were no ethical considerations to be considered in this research.
Funding
This research did not receive any grant from funding agencies in the public, commercial, or non-profit sectors.
Authors' contributions
Conceptualisation and sudy design: Srinivas Maddi; Experiments: Bajee Shaik and Biswajit Swain; Data analysis, and witing the original draft: Bajee Shaik; Review and editing: Eswar Gupta and Srinivas Maddi.
Conflict of interest
The authors declared no conflict of interest.
Acknowledgments
The authors would like to thank the authorities of Acubiosys Private Limited and Krupanidhi College of Pharmacy affiliated with Rajiv Gandhi University of Health Sciences, Bengaluru, India for their support.
References
- Mei S, Perumal M, Battino M, Kitts DD, Xiao J, Ma H, et al. Mangiferin: A review of dietary sources, absorption, metabolism, bioavailability, and safety. Crit Rev Food Sci Nutr. 2023; 63(18):3046-64. [DOI:10.1080/10408398.2021.1983767] [PMID]
- Du S, Liu H, Lei T, Xie X, Wang H, He X, et al. Mangiferin: An effective therapeutic agent against several disorders (Review). Mol Med Rep. 2018; 18(6):4775-86. [DOI:10.3892/mmr.2018.9529]
- Bijak M. Silybin, a major bioactive component of milk thistle (Silybum marianum L. Gaernt.)-chemistry, bioavailability, and metabolism. Molecules. 2017; 22(11):1942. [DOI:10.3390/molecules22111942] [PMID] [PMCID]
- Vollono L, Falconi M, Gaziano R, Iacovelli F, Dika E, Terracciano C, et al. Potential of curcumin in skin disorders. Nutrients. 2019; 11(9):2169. [DOI:10.3390/nu11092169] [PMID] [PMCID]
- Sabir AM, Moloy M, Bhasin PS. HPLC method development and validation: A review. Int Res J Pharm. 2013; 4(4):39-46. [DOI:10.7897/2230-8407.04407]
- Baghel US, Nagar A, Pannu MS, Singh DE, Yadav R. HPLC and HPTLC methods for simultaneous estimation of quercetin and curcumin in polyherbal formulation. Indian J Pharm Sci. 2017; 79(2):197-203. [DOI:10.4172/pharmaceutical-sciences.1000217]
- Patil P, Shrotriya S, Mulgund S. Development and validation of a RP-HPLC method for simultaneous quantitation of resveratrol and curcumin: Application to nanolipid gel formulation. Int J Pharm Sci Med. 2021; 6:24-36. [DOI:10.47760/ijpsm.2021.v06i02.003]
- Khismatrao AN, Bhairy SR, Hirlekar RA. Development and validation of RP-HPLC method for simultaneous estimation of curcumin and piperine. Int J Appl Pharm. 2018; 10(5):43-8. [DOI:10.22159/ijap.2018v10i5.21140]
- Naveen P, Lingaraju HB, Prasad KS. Rapid development and validation of improved reversed-phase high-performance liquid chromatography method for the quantification of mangiferin, a polyphenol xanthone glycoside in mangifera indica. Pharmacognosy Res. 2017; 9(2):215-9. [DOI:10.4103%2F0974-8490.204652] [PMID] [PMCID]
- Kumar Kammalla A, Kumar Ramasamy M, Aruna A, Kaliappan I. Development and validation of a RP-HPLC method for the simultaneous determination of Mangiferin, Ellagic acid and Hydroxycitric acid in polyherbal formulation. Pharmacognosy J. 2014; 1(3):23-8. [DOI:10.5530/pj.2014.3.4]
- Katsagonis A, Atta-Politou J, Koupparis MA. HPLC method with UV detection for the determination of trans-resveratrol in plasma. J Liq Chromatogr Relat Technol. 2005; 28(9):1393-405. [DOI:10.1081/JLC-200054884]
- Desai NE, Momin M, Singh UP, Khan TA, Sherje A. Analytical method development and validation for simultaneous estimation of curcumin and cyclosporine by RP-HPLC. Int J Pharm Pharm Sci. 2019; 11:26-33. [DOI:10.22159/ijpps.2019v11i2.28975]
- Patil N, Mahajan H. Development and validation of RP-HPLC method for simultaneous qualitative and quantitative estimation of curcumin and quercetin in bulk mixture. Indian J Pharm Educ Res. 2022; 56(1):247-54. [DOI:10.5530/ijper.56.1.29]
- Shaik B, Eerla A, Palatheeya S, Veerareddy PR, Maddi S. A validated HPLC method for the simultaneous quantification of curcumin, silybin, and psoralen: Application to phytopharmaceuticals. Revista Brasileira de Farmacognosia. 2023; 33(3):610-6. [DOI:10.1007/s43450-023-00392-9 ]
- Kasar PM, Kale KS, Phadtare DG. Formulation and evaluation of topical antifungal gel containing itraconazole. Res J To Cosmet Sci. 2018; 9(2):49-52. [DOI:10.5958/2321-5844.2018.00010.9]
- Uddin MN, Samanidou VF, Papadoyannis IN. Development and validation of an HPLC method for the determination of benzodiazepines and tricyclic antidepressants in biological fluids after sequential SPE. J Sep Sci. 2008; 31(13):2358-70. [DOI:10.1002/jssc.200800079] [PMID]
- Bao Q, Newman B, Wang Y, Choi S, Burgess DJ. In vitro and ex vivo correlation of drug release from ophthalmic ointments. J Control Release. 2018; 276:93-101. [DOI:10.1016%2Fj.jconrel.2018.03.003] [PMID] [PMCID]
- Kurangi B, Jalalpure S, Jagwani S. A validated stability-indicating HPLC method for simultaneous estimation of resveratrol and piperine in cubosome and human plasma. J Chromatogr B Analyt Technol Biomed Life Sci. 2019; 1122-1123:39-48. [DOI:10.1016/j.jchromb.2019.05.017] [PMID]
Type of Study: Original Research |
Subject:
Industrial Pharmacy
| Rights and permissions | |
 |
This work is licensed under a Creative Commons Attribution-NonCommercial 4.0 International License. |
This is an open access article distributed under the terms of the Creative Commons Attribution License (CC-By-NC), which permits use, distribution, and reproduction in any medium, provided the original work is properly cited and is not used for commercial purposes.
Contact Information