Volume 10, Issue 2 (2024)
Pharm Biomed Res 2024, 10(2): 121-134 |
Back to browse issues page
Download citation:
BibTeX | RIS | EndNote | Medlars | ProCite | Reference Manager | RefWorks
Send citation to:


BibTeX | RIS | EndNote | Medlars | ProCite | Reference Manager | RefWorks
Send citation to:
Bishal A, DEbnath B, Gayen B, Bandyopadhyay B, Payra S, Maji R et al . Comparing Hydroxypropyl Methylcellulose and Guar Gum on Sustained Release Effect of Metformin Hydrochloride Matrix Tablet. Pharm Biomed Res 2024; 10 (2) :121-134
URL: http://pbr.mazums.ac.ir/article-1-590-en.html
URL: http://pbr.mazums.ac.ir/article-1-590-en.html
Amlan Bishal1 

 , Biplab DEbnath1
 , Bikash Gayen1

 , Bratati Bandyopadhyay1

 , Surjendu Payra1

 , Rishav Maji1

 , Kazi Asraf Ali *2


 , Biplab DEbnath1
 , Bikash Gayen1

 , Bratati Bandyopadhyay1

 , Surjendu Payra1

 , Rishav Maji1

 , Kazi Asraf Ali *2


1- Department of Pharmaceutical Technology, Bharat Technology, Howrah, India.
2- Division of Pharmaceutics, Department of Pharmaceutical Technology, Maulana Abul Kalam Azad University of Technology, Kolkata, India.
2- Division of Pharmaceutics, Department of Pharmaceutical Technology, Maulana Abul Kalam Azad University of Technology, Kolkata, India.
Full-Text [PDF 1876 kb]
(924 Downloads)
| Abstract (HTML) (2360 Views)
Full-Text: (1854 Views)
Introduction
Nowadays, diabetes accounts for the increasing rate of mortality in the globe. Diabetes is a chronic medical condition that disrupts the body's natural capacity to utilize food as its energy source. In diabetes, the body generates inadequate insulin, a circumstance that can result in significant health complications such as coronary artery disease, impaired vision, and kidney damage [1]. Two categories can be used for diabetes mellitus: Type I (non-insulin-dependent diabetes mellitus), which is the most prevalent, and type II (juvenile diabetes, often known as insulin-dependent diabetes). Oral drugs are the most popular methods (nasal, ocular, transdermal, rectal, and injectable) that have been researched for systemic administration via drug formulation of various doses. The oral pathway is recognized as the most widely accepted, convenient, and secure method due to its ease of application, patient receptiveness, and cost-effective production approach [2, 3].
Continual drug distribution with predictable and repeatable kinetics over a prolonged duration in circulation is the goal of novel drug delivery systems. This idea may have fewer drug-related side effects since therapeutic blood levels are controlled rather than fluctuating, patient compliance is improved because of less frequent dosing, and there is a decrease in the overall amount of medicine delivered. So, combining both controlled and prolonged release qualities in a delivery method might further increase therapeutic efficacy [4, 5].
A sustained release system for drug delivery has been created that may target administration to tissue and or sustain the rate of drug administration while maintaining a period of therapeutic activity. Usually, in a sustained-release medication system, the target is to give the medicine at a predetermined rate. So far, the system delivers the medicine, and blood levels stay safe and effective. Instead of the uncontrolled swings observed when a patient gets several doses of traditional immediate-release dosage forms, sustained-release medication delivery often produces a steady plasma concentration of the active component [6]. One dose of metformin hydrochloride can have a therapeutic effect on our bodies for up to 12 hours, making it the best medicine to employ as a sustained-release administration method. Metformin hydrochloride reduces postprandial and basal plasma glucose levels and helps diabetes patients control their blood glucose fluctuations.
When compared to another oral anti-diabetic tablet, it has distinct pharmacologic action. Metformin decreases hepatic glucose synthesis, intestinal glucose absorption, and insulin sensitivity by boosting glucose uptake and utilization. Contrary to sulfonylureas, metformin does not result in hyperinsulinemia or hypoglycemia in either non-insulin-dependent diabetes individuals or healthy individuals [7, 8, 9]. In our study, we formulated a metformin-sustained release formulation with two different rate-controlling polymers: Guar gum as a natural source of polymer and hydroxy propyl methylcellulose (HPMC) of grade K100M as a synthetic source of matrix polymer [10-12].
Materials and Methods
Materials
Metformin hydrochloride drug was supplied as a gift sample from Granules India Ltd. HPMC of grade K100M used as matrix-forming polymer was supplied by Colorcon India Pvt. Ltd. Guar gum was used as natural polymer supplied by Loba Chemie Pvt. Ltd. Povidone used as binder, microcrystalline cellulose used as diluent, talcum and magnesium stearate used as glidant and lubricant were supplied by Yarrow Chem Products.
Methods
Assessment of compatibility between drugs and excipients
After grasping the physicochemical properties of metformin hydrochloride and the accompanying excipients, a compatibility evaluation between the medication and excipients was carried out as a preliminary step in the formulation strategy. Initially, we recorded the attenuated total reflectance (ATR) infrared spectra of the pure drug and its mixture with polymers. These recordings were made both at the outset and after the samples had been stored for 15 days in a controlled environment at a temperature of 40±2°C and a relative humidity (RH) of 75%±5% within a stability chamber. The primary objective of the ATR-infrared (IR) study was to investigate potential interactions between the drug and polymers. The infrared spectrum was analyzed over a range of 4000-400 cm-1, and alterations in transmittance were observed [6, 13].
Metformin matrix tablet preparation
Metformin hydrochloride polymer matrix tablets were prepared through the wet granulation technique, utilizing PVPK30 as the binding agent. Various formulations were prepared by altering the ratios of synthetic (HPMC K100M) and natural polymers (guar gum) as per Table 1.

The following steps were followed
Phase 1: Transitioning: Metformin hydrochloride was measured and passed through a 40# screen. Microcrystalline cellulose, Hydroxypropyl methylcellulose, and guar gum were measured according to the desired quantities and passed through the same screen.
Phase 2: Dry blending: The sifted materials mentioned above were placed into a mortar and pestle and continuously mixed for 15 minutes. This process aimed to achieve a consistent mixture of the drug substance and excipients. Subsequently, the dry blended mixture's loss on drying (LOD) was assessed, along with its uniformity.
Phase 3: Binder solution preparation: The required quantity as per the formula of polyvinylpyrrolidone (PVPK30) was carefully weighed and gently added to that beaker containing distilled water of desired quantity for making optimized granules and stirred continuously to get PVPK30 completely dissolved in the solvent and formed a transparent binder solution.
Phase 4: Wet blending: The binder solution was carefully mixed with the dry mix until a cohesive wet mass was obtained. The final point of granulation was identified through constant visual monitoring of granule production.
Phase 5: Wet sifting: To get particles of the same size, wet material was filtered through a 10# screen.
Phase 6: Drying of wet granules: Wet sifted granules were allowed to dry at ambient temperature for 10 minutes before being placed in a tray drier at 50°C to attain the desired LOD of nearly 2.5%
Phase 7: Dry screening: The desired granules, after drying, were screened through a 20# screen and stored in a polybag with proper locking.
Phase 8: Pre-lubrication: Talc sifted through a 40# screen, was added to the step 7 granules, and mixed for 10 minutes to get a pre-lubricated blend.
Phase 9: Lubrication: Magnesium stearate screened through 60# and added to the pre-lubricated granules and mixed for two minutes to get the final lubricated granules ready for compression.
Phase 10: Compression of granules: Compression was done in an 8-station multi-tooling compression machine fitted with 19.5×9.0 mm caplet-shaped bi-concave punches. A steady compression force was applied to obtain a tablet hardness of 5-8 kg/cm2. We examined and recorded additional physical characteristics and then securely stored the tablets in sealed containers for future use.
Pre-compressional properties
The angle of repose: The assessment of frictional forces within powdered material and the cohesion among particles are involved in the computation of the angle of repose. This angle, which is the maximum inclination formed between the surface of a pile of powder and the horizontal plane, was determined to gauge these influences. The angle of repose was derived using either the fixed cone method or the fixed funnel method. The equation utilized for the angle of repose calculation is as follows [12, 14, 15] (Equation 1):
1. θ=tan-1 (h/r)
(where, θ=angle of repose, h=height of pile, r=radius of base of the hip of powder).
Bulk density: A precisely measured 50 g of desiccated granules were placed into a 50 mL graduated measuring cylinder. The granule bed was then leveled to ensure uniformity, and the volume occupied was recorded according to the graduation marks on the cylinder. This volume was expressed in g/mL, and its calculation was carried out using the Equation 2 [6]:

Tapped density: The tapped density of a powder is determined by the relationship between the powder's mass and the volume it occupies after being tapped for a specific duration. The process involves manually tapping the graduated cylinder containing precisely weighed powder for 500 taps. Subsequently, the volume occupied by the granules after 500 taps is recorded. Tapped density is then computed using the Equation 3 and its unit is grams per milliliter (g/mL) [6]:

Carr's index: Carr's index often called the compressibility index, serves as a valuable indicator for assessing the flow properties of powders. The equation offers a precise definition of this concept. The compressibility index is measured through the Equation 4:
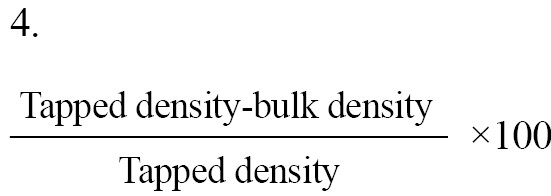
Hausner's ratio: The Hausner's ratio is a numerical value that signifies the flow behavior of a powder or granular substance as it moves through a hopper during compression [6, 16]:
Hausner's ratio=Tapped density/Bulk density.
Differential scanning calorimetry
The used calorimeter was the DSC2500 from Germany, equipped with an intercooler and refrigerated cooling system. An indium standard was employed to calibrate the DSC temperature and enthalpy scale. The DSC cell was purged with nitrogen gas at a 50 mL/min flow rate via the cooling unit. Samples weighing 5-10 mg were airtight sealed within aluminum pans, and the heat transfer rate was maintained at 5°C per minute [17].
Surface morphology and particle size analysis of metformin HCl granules
Metformin HCl granules' surface morphology and shape were checked under a scanning electron microscope (SNE-3200M of SEC Global Pvt. Ltd.) at a resolution of ~15 nm, 1-30 kV voltage, and magnification of 60000. The scanning electron microscope analysis reflected that the prepared granules have a spheroidal shape with smooth surface characteristics. Particle size analysis of the optimized batch was performed using polarized light microscopy fitted with a calibrated ocular micrometer. All granules reflected a narrow particle size distribution ranging from 1148±152 to 1326±126 µm [18].
Post-compressional evaluation of matrix tablets
Weight variation: Ideally, each tablet within a batch should exhibit consistent weight, but slight variations in individual tablet weights may naturally occur. Therefore, pharmacopeia permits a limited weight variation in tablets. The USP (The United States Pharmacopeial Convention) allows for a specific percentage deviation in weight variation. To assess weight variation in each batch of tablets, 20 tablets were selected and their weights and average weights were determined using an electronic balance [19].
Hardness: The tablets' hardness across all formulations was assessed using the monsanto hardness tester. The mean hardness of three tablets was determined for each formulation and subsequently recorded.
Thickness: After removing any surface dust from 20 individual tablets, their individual crown-to-crown thickness was measured by placing them parallel between the jaws of a digimatic caliper. The measurements were documented, and the sample's Mean±SD were computed.
Friability: The friability test assesses a tablet's ability to endure wear and tear during packing, handling, and transportation. This evaluation is carried out using a device known as the "Friabilator." A roche friabilator was employed to determine the friability of the tablets. This apparatus exposes a group of tablets (six in this case) to a combination of abrasion and shock within a rotating plastic chamber, which makes 25 rpm, dropping the tablets a distance of six inches with each rotation. Initially, six tablets were weighed and placed in the Friabilator, and then the device was operated for 100 revolutions. Afterward, the tablets were de-dusted and weighed once again (Equation 5):
5.
Friability (%)=[(W0-W1)/W0]×100,
where, W0=initial weight and W1=final weight.
Drug content
Ten tablets from each formulation were measured and crushed into a fine powder using a mortar. A 100 mL phosphate buffer with a pH of 6.8 was used to extract a powder containing 500 mg of metformin hydrochloride. Subsequently, the solution was filtered using Whatman filter paper. The concentration of the drug was determined using a Shimadzu UV 1780 UV-visible spectrophotometer, maintaining an absorbance reading at 233 nm. The filtrate liquid was cautiously diluted with pH 6.8 phosphate buffer before measurement [13, 14].
Dissolution study
Utilizing a USP type II dissolution apparatus operating at a rotational velocity of 100 rpm, an in vitro investigation was conducted to assess the dissolution profile of matrix tablets containing metformin hydrochloride. The tablets were subjected to various dissolution media to simulate conditions within the gastrointestinal tract. Specifically, the dissolution media comprised 0.1 NHCl acidic buffer for the initial two-hour period, followed by 900 mL of pH 6.8 phosphate buffer for the subsequent 10-h duration. The temperature was maintained at 37±0.5°C throughout the dissolution process.
Five milliliters of aliquots of the sample solution were withdrawn from the dissolution apparatus at regular intervals. After each withdrawal, the samples were promptly replaced with a fresh dissolution medium to maintain sink conditions. Subsequently, the collected samples underwent filtration through a 0.45-μm membrane filter. The drug content was quantified in each sample by measuring the absorbance at 233 nm using a UV-spectrophotometer (SHIMADZU UV 1780) after appropriate dilution. The cumulative percentage of drug release was then calculated using an equation derived from a calibration curve [20, 21].
Drug release kinetic
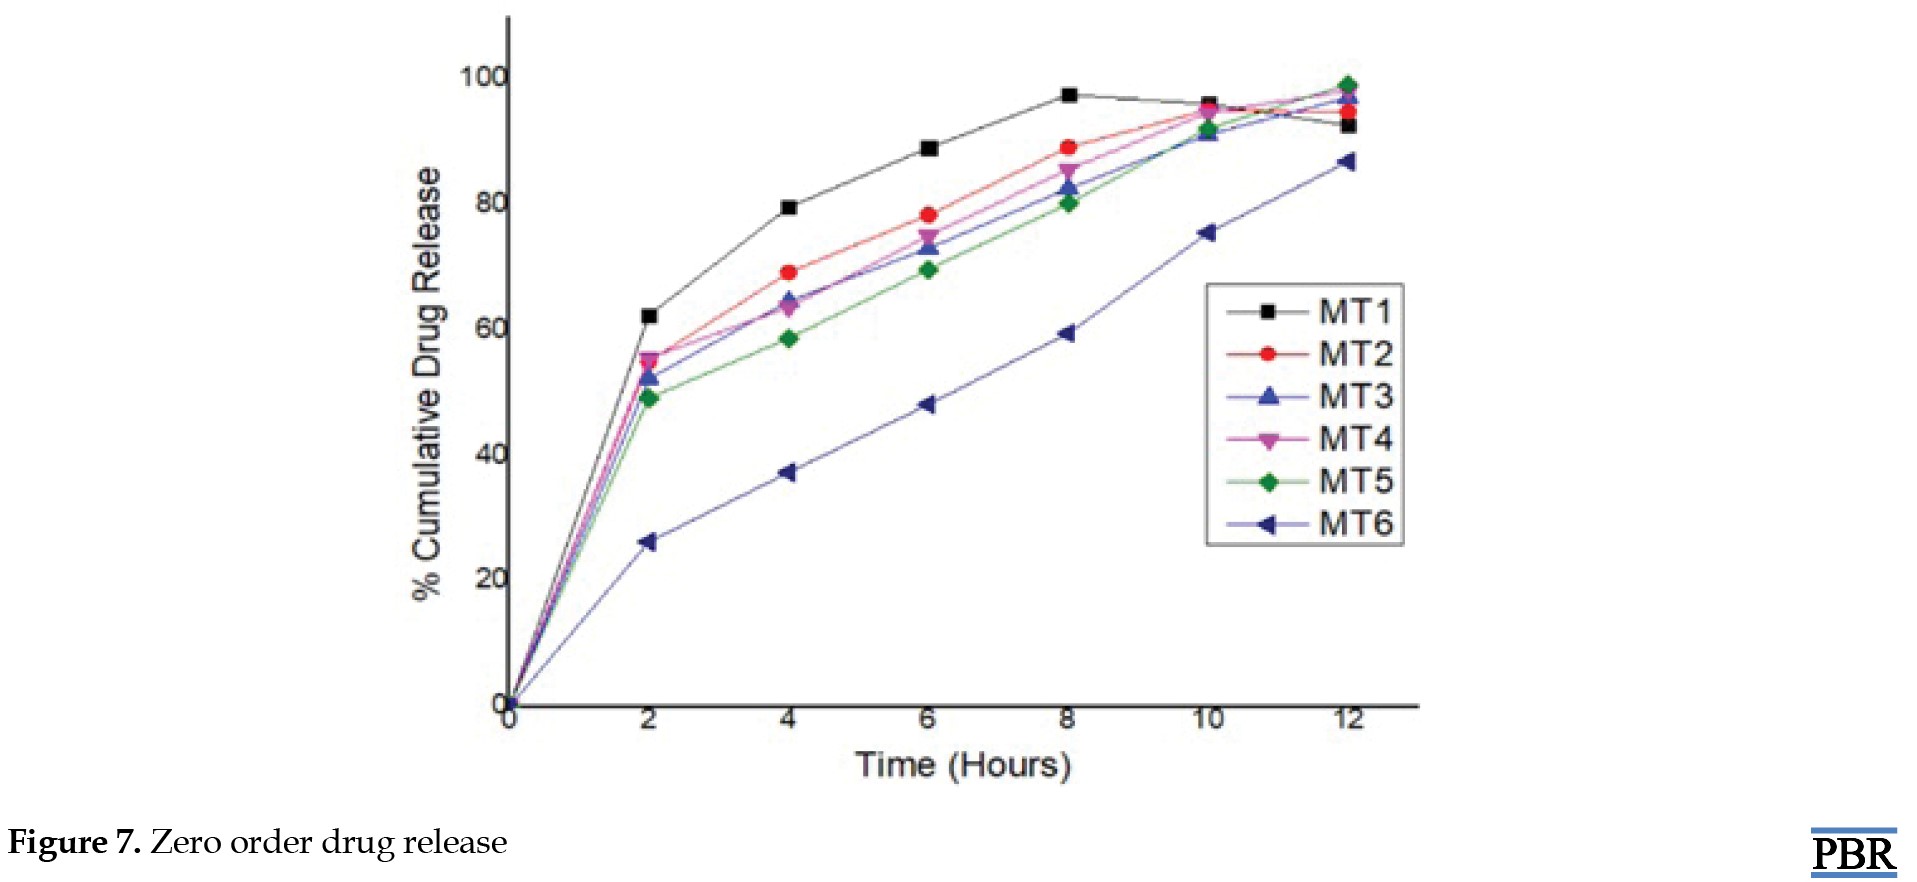
The in vitro drug release data underwent fitting to the following mathematical models, aiming to analyze the release mechanism of metformin hydrochloride from sustained-release matrix tablets [3, 4, 17] (Equation 6):
6. Zero-order release model: Qt=Q0+K0t
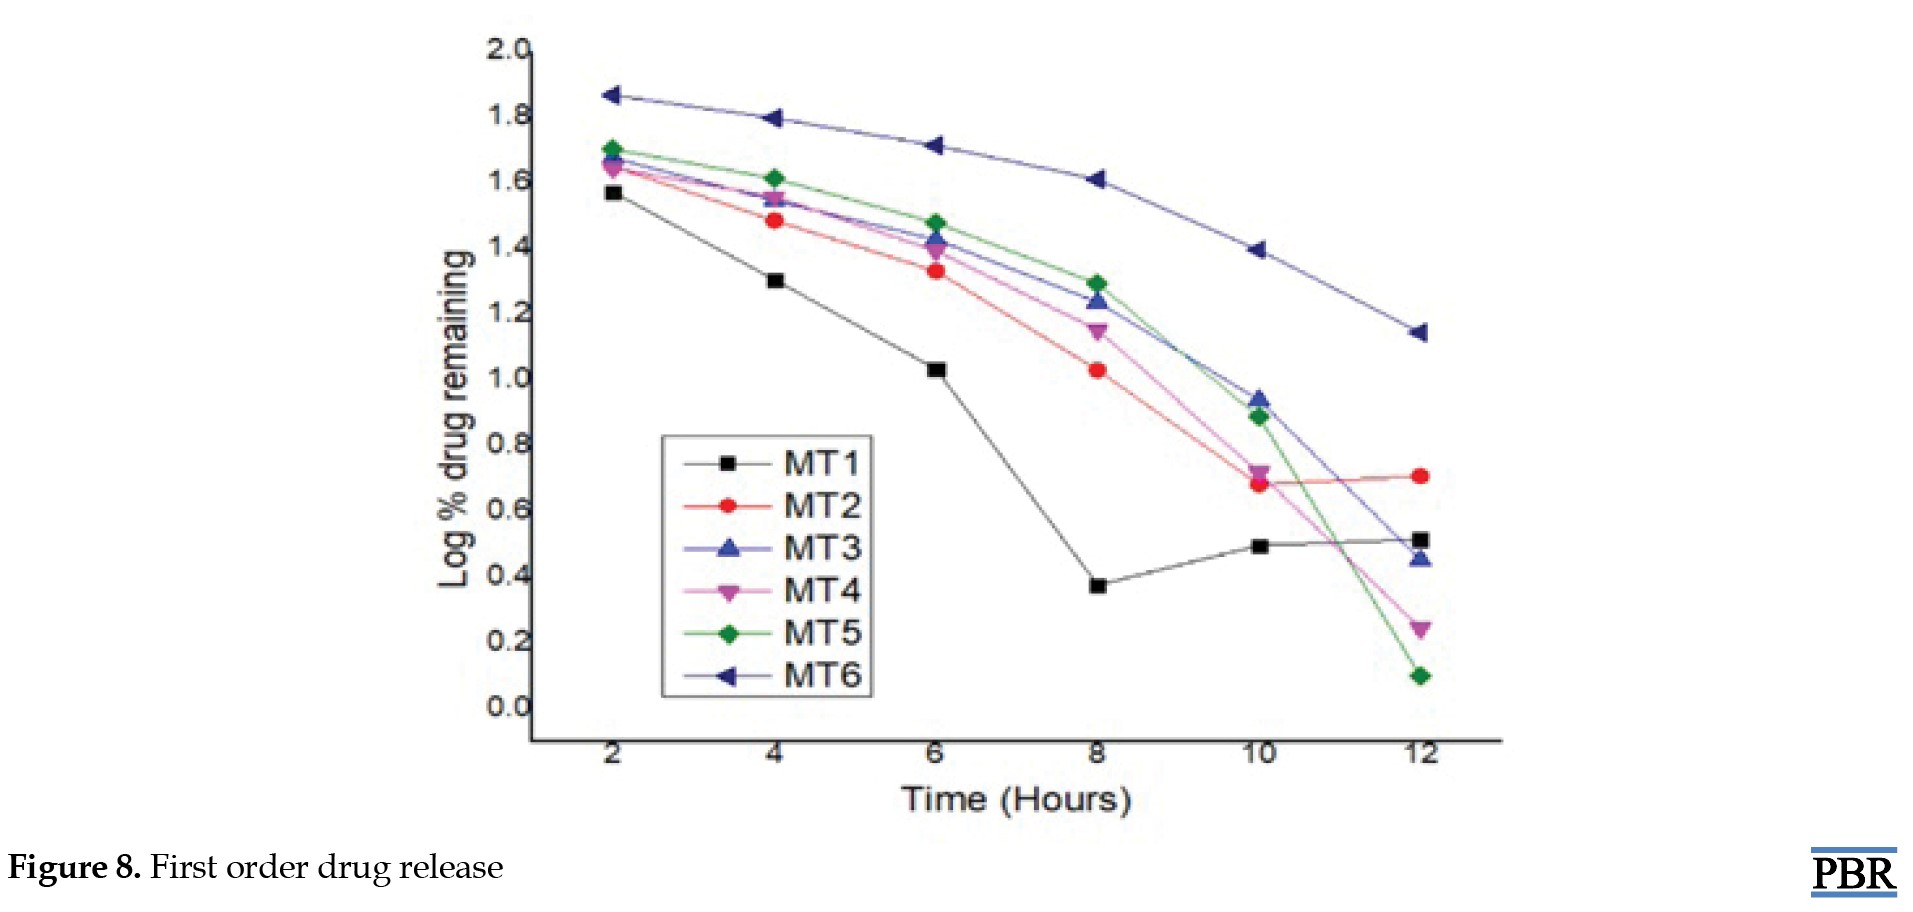
First-order release model: LogC=LogC0+Kt/2.303
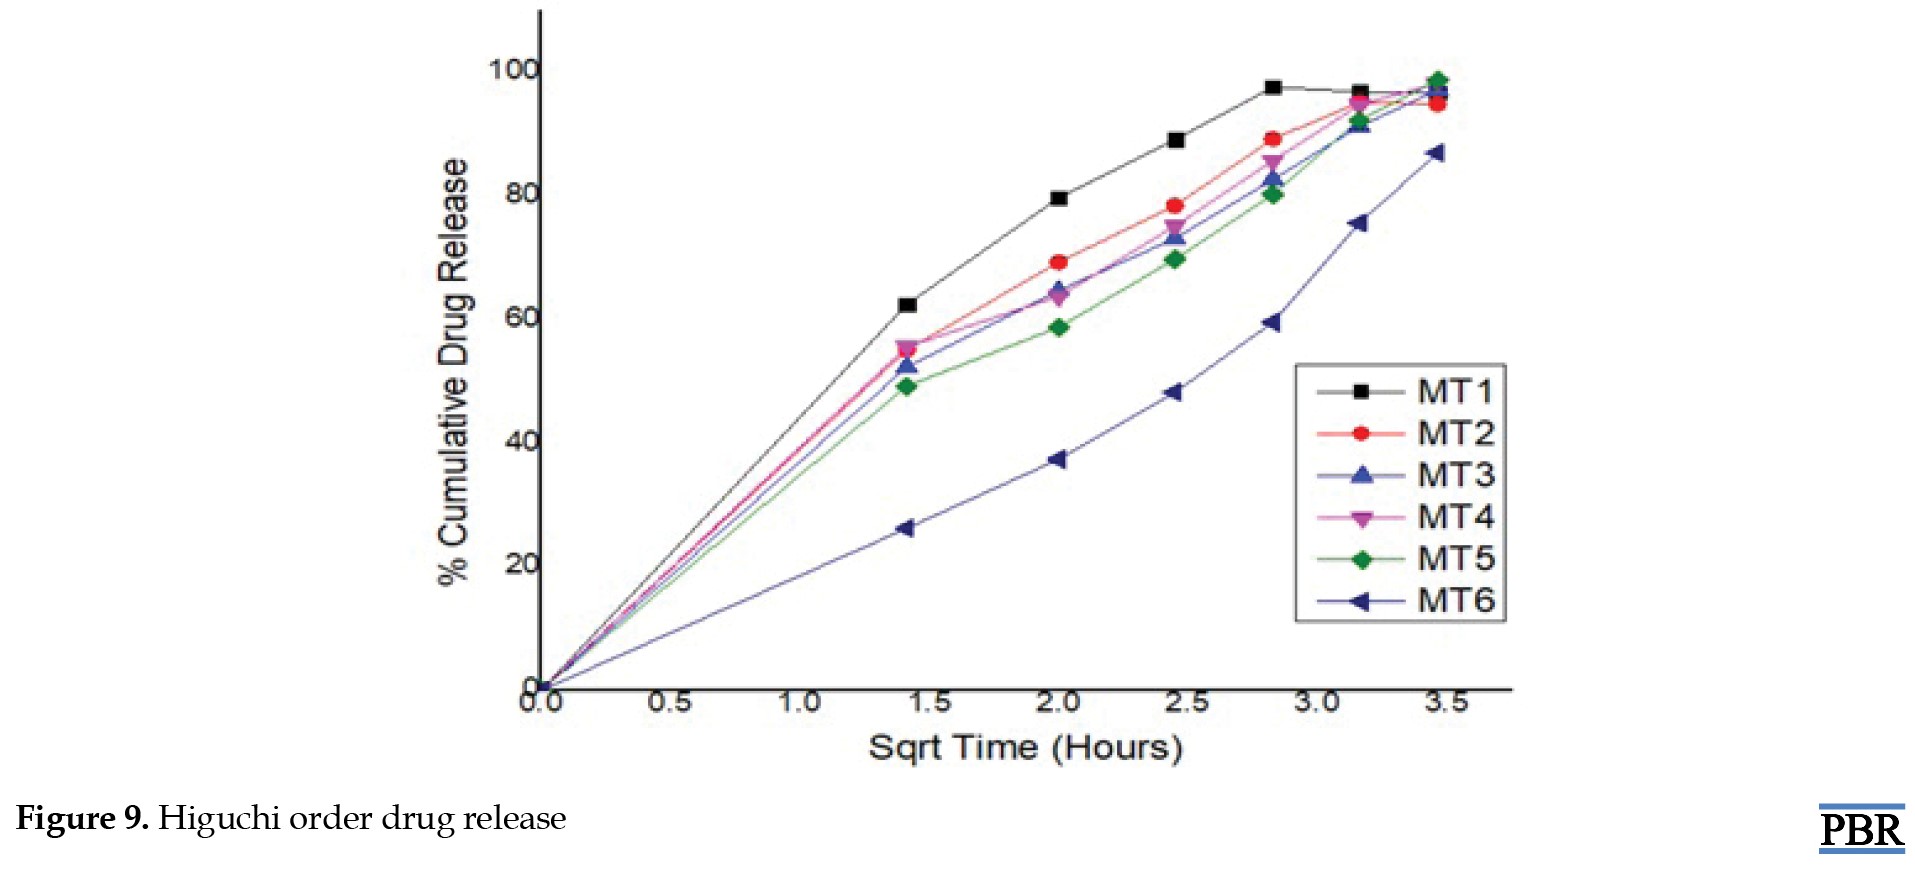
Higuchi's model: Qt=Kh√t
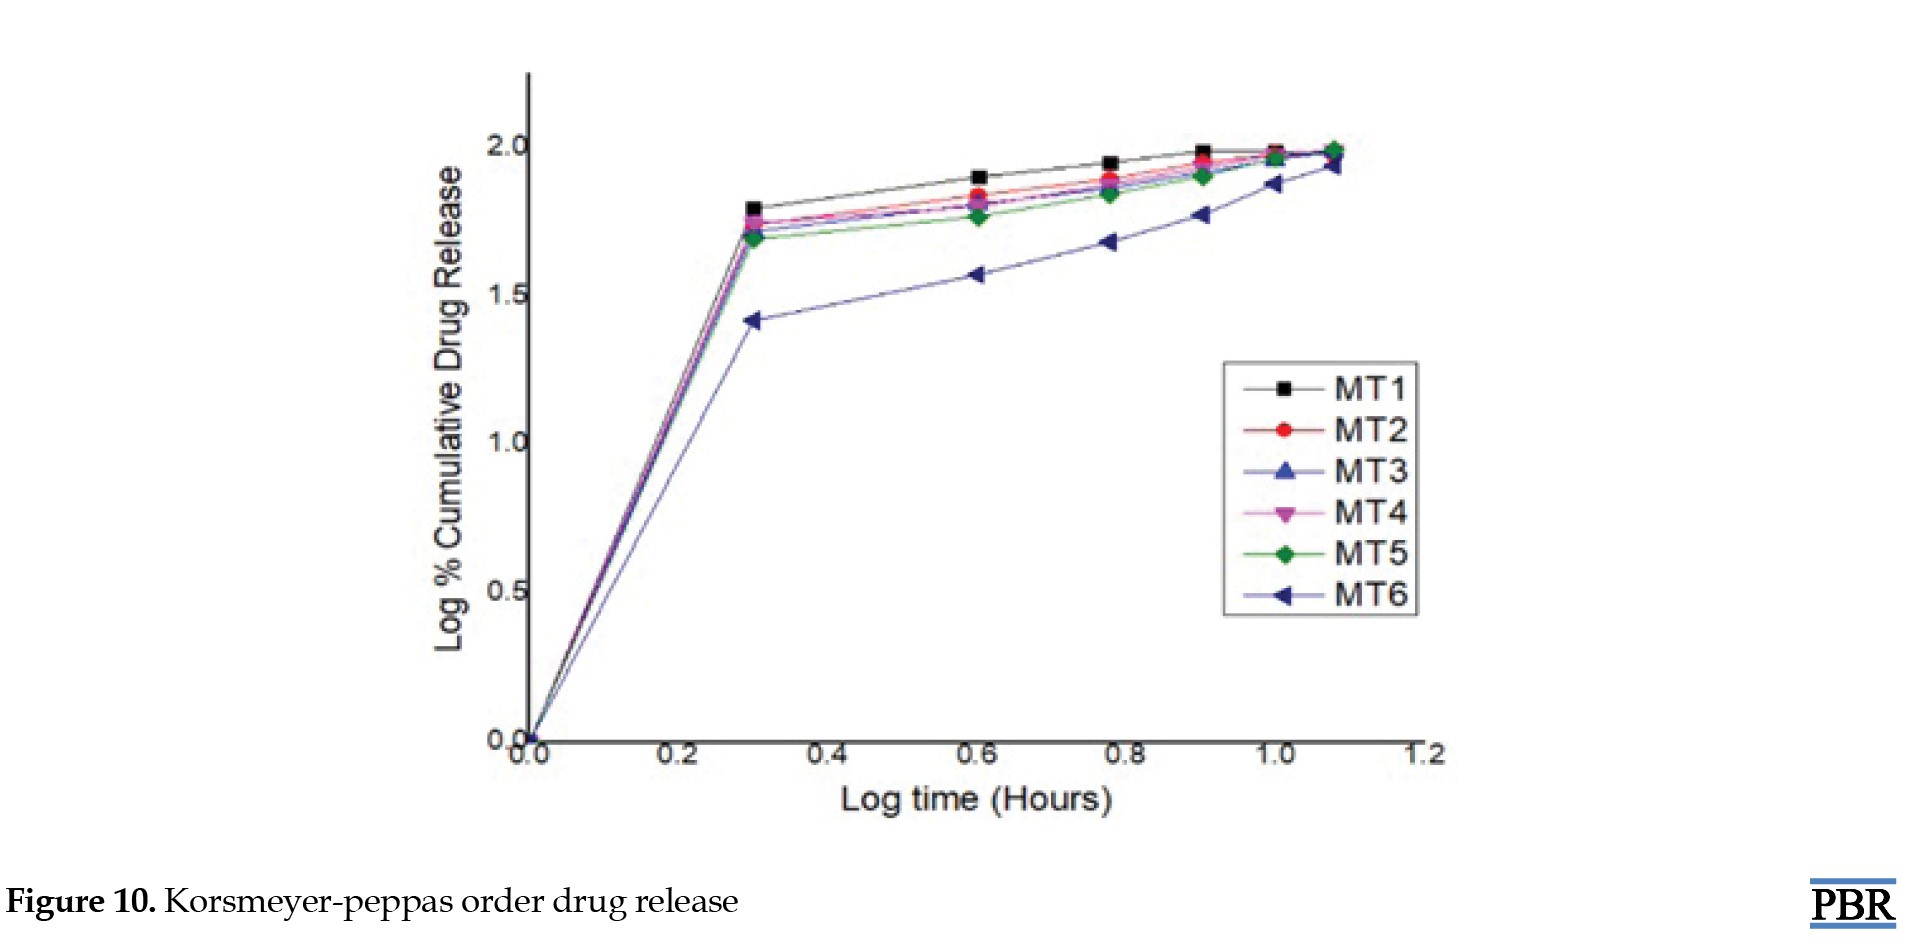
Korsmeyer-Peppas model: Qt/Qα=Kp tn
Here, in the context of these models, Q0, Q and Q denote the initial, t-time, and infinite-time quantities of drug dissolution, respectively. W0 and Wt represent the drug quantities in the pharmaceutical dosage form at the start and time t, respectively. C0 and C stand for the initial and time t drug concentrations. The rate constants K0, K1, Kh and Kp are determined through the linear curves of their respective models. The diffusional exponent, denoted as "n," characterizes the mechanism of drug release (Table 2).

To ascertain the relationships, regression analysis was employed to establish coefficient values between log Qt/Q and log time. The gradient of the regression equation provided the value of the diffusional exponent "n," while the antilogarithm of the intercept value facilitated the determination of Kp.
Comparative dissolution study with market product
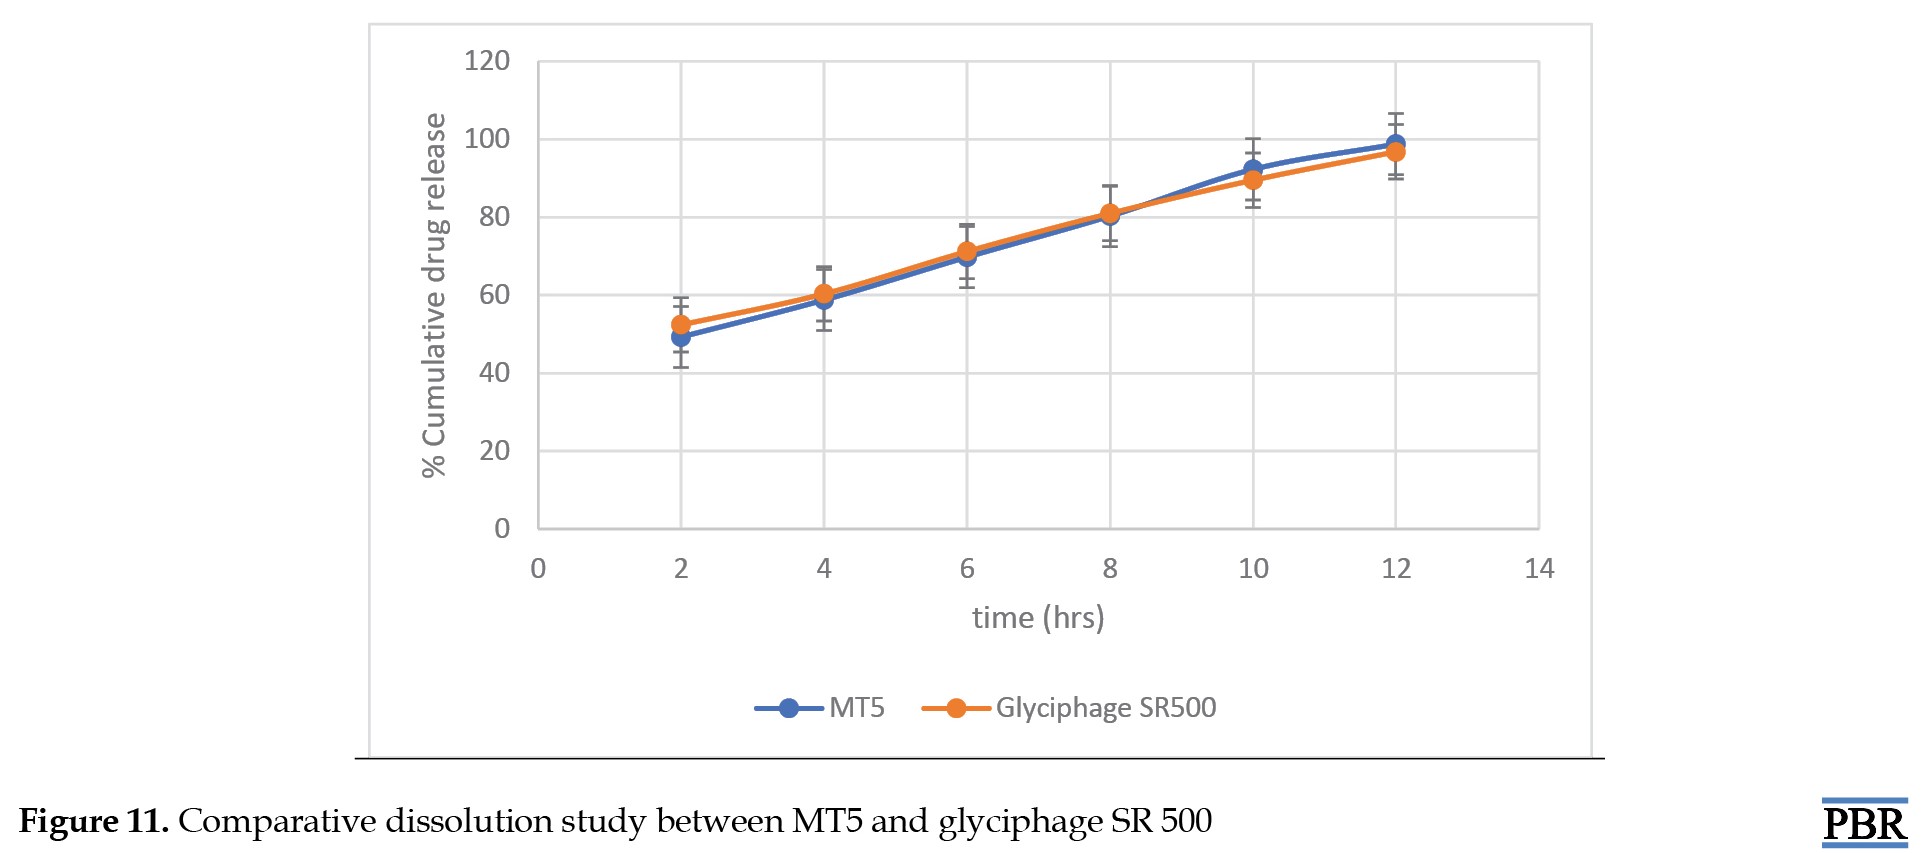
A comparative dissolution study has been done between the formulated tablet (MT5) and marketed tablet (Glyciphage SR 500 of FRANCO-INDIAN Pharmaceuticals PVT. LTD) to check the similarity and dissimilarity factors between the two samples.
Results
ATR-IR interpretation of metformin hydrochloride
ATR-IR analysis indicated that metformin HCl displayed distinct peaks at 3367.33 and 3292.94 cm-1 originating from the primary N-H stretching vibration, along with a peak at 3147.03 cm-1 associated with secondary N-H stretching. Notably, characteristic peaks were observed at 1622.15 and 1560.64 cm-1, corresponding to C=N stretching vibrations, as shown in Figure 1.
Conducting a compatibility study between the drug and excipients to investigate physical interactions
Following the experimentation and analysis of the peaks within the ATR-IR spectra, it was noted that no interaction transpired between the drugs and excipients even after a 15-day storage period under conditions of 40±2°C and 75%±5% RH. Furthermore, there were no observable alterations in the drug's inherent characteristics, as evidenced by the ATR-IR spectra of the drug and the physical mixture. Figures 2 and 3 demonstrate that the drug maintains compatibility with all employed excipients in the formulation. Construction of a standard curve for metformin HCL utilizing pH 6.8 phosphate buffer
A standard curve was constructed with the various concentration of metformin hydrochloride and their obtained absorbance using phosphate buffer pH 6.8 in absorption maxima of 233 nm using a UV-spectrophotometer (SHIMADZU UV 1780) as shown in Figure 4.
Characterization of granules (precompression parameters)
The bulk density, tapped density, compressibility index, Hausner's ratio, and angle of repose of the lubricated blend were all investigated for all formulations (Table 3).
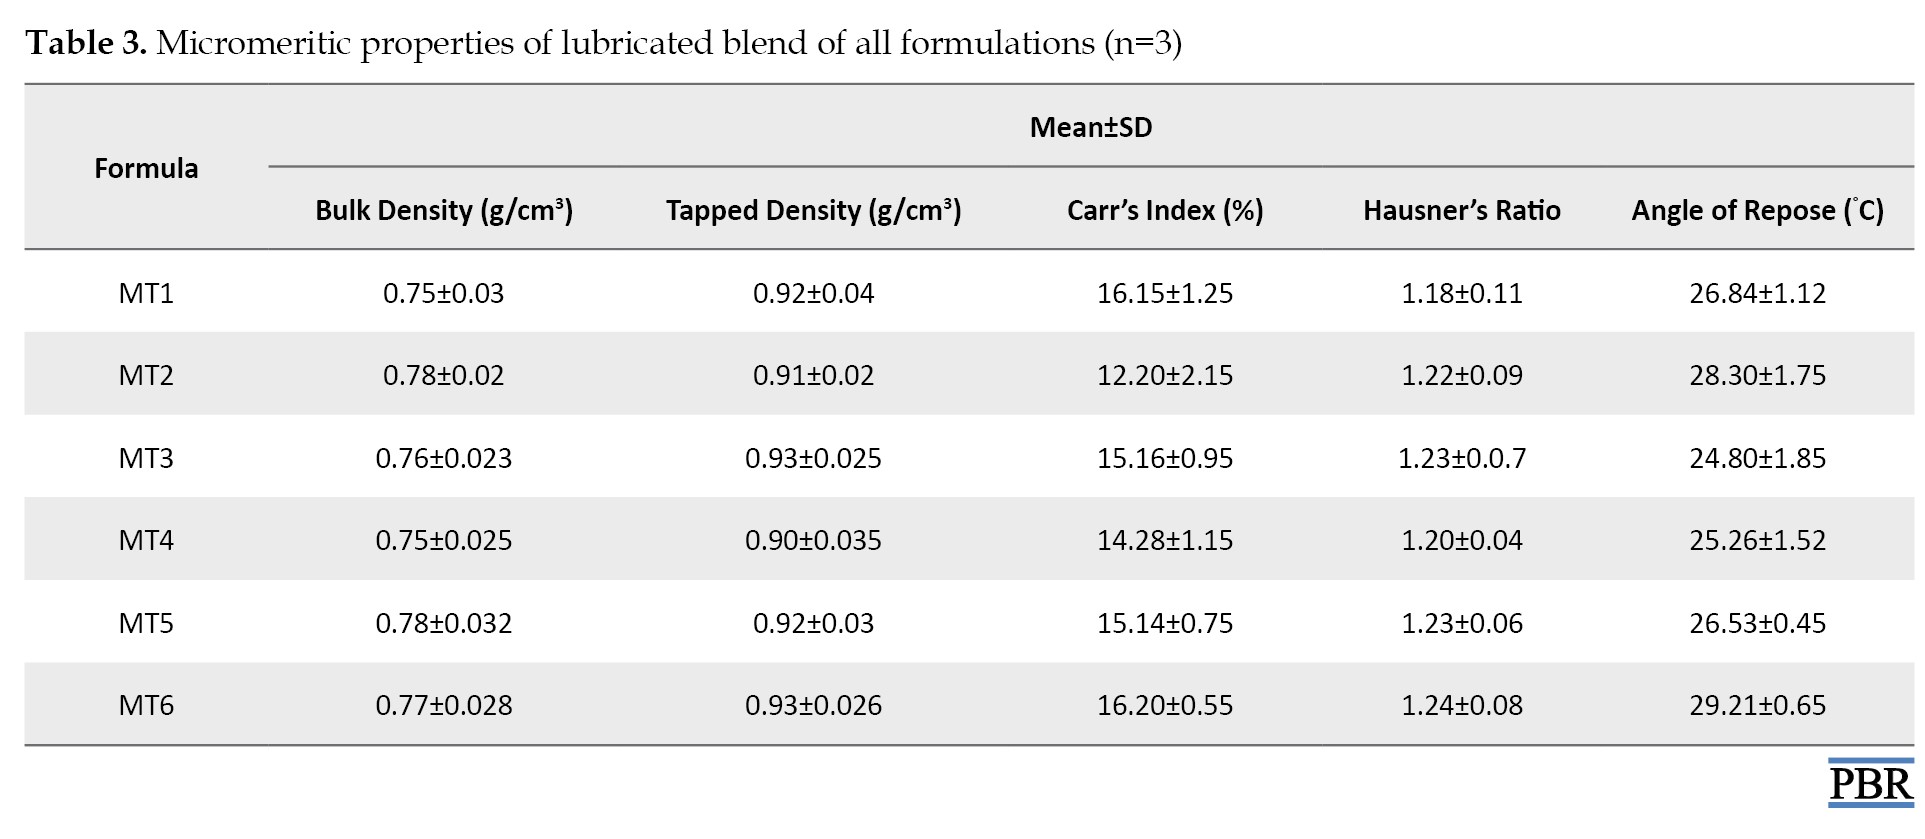
The bulk and tapped densities ranged from 0.77 to 0.80 g/cm3 and 0.87 to 0.95 g/cm3, respectively. By increasing the lubricant content, the flow qualities of the powder mix improved from fair to passable at first. The angle of repose values ranges from 27.65°C to 38.29°C. All the formulations' Carr's compressibility indices ranged from 11.49% to 16.13%, indicating that the powder combination had acceptable flow characteristics. The Hausner's ratio, which varied from 1.12 to 1.23, was also computed.
Discussion
Differential scanning calorimetry (DSC)
The thermal curve of pure metformin exhibited an initial flat profile followed by a sharp endothermic peak at 227°C (representing the melting point of metformin). Granules also show similar peaks (Figure 5).
Evaluation of surface morphology and particle size analysis of metformin HCl granules
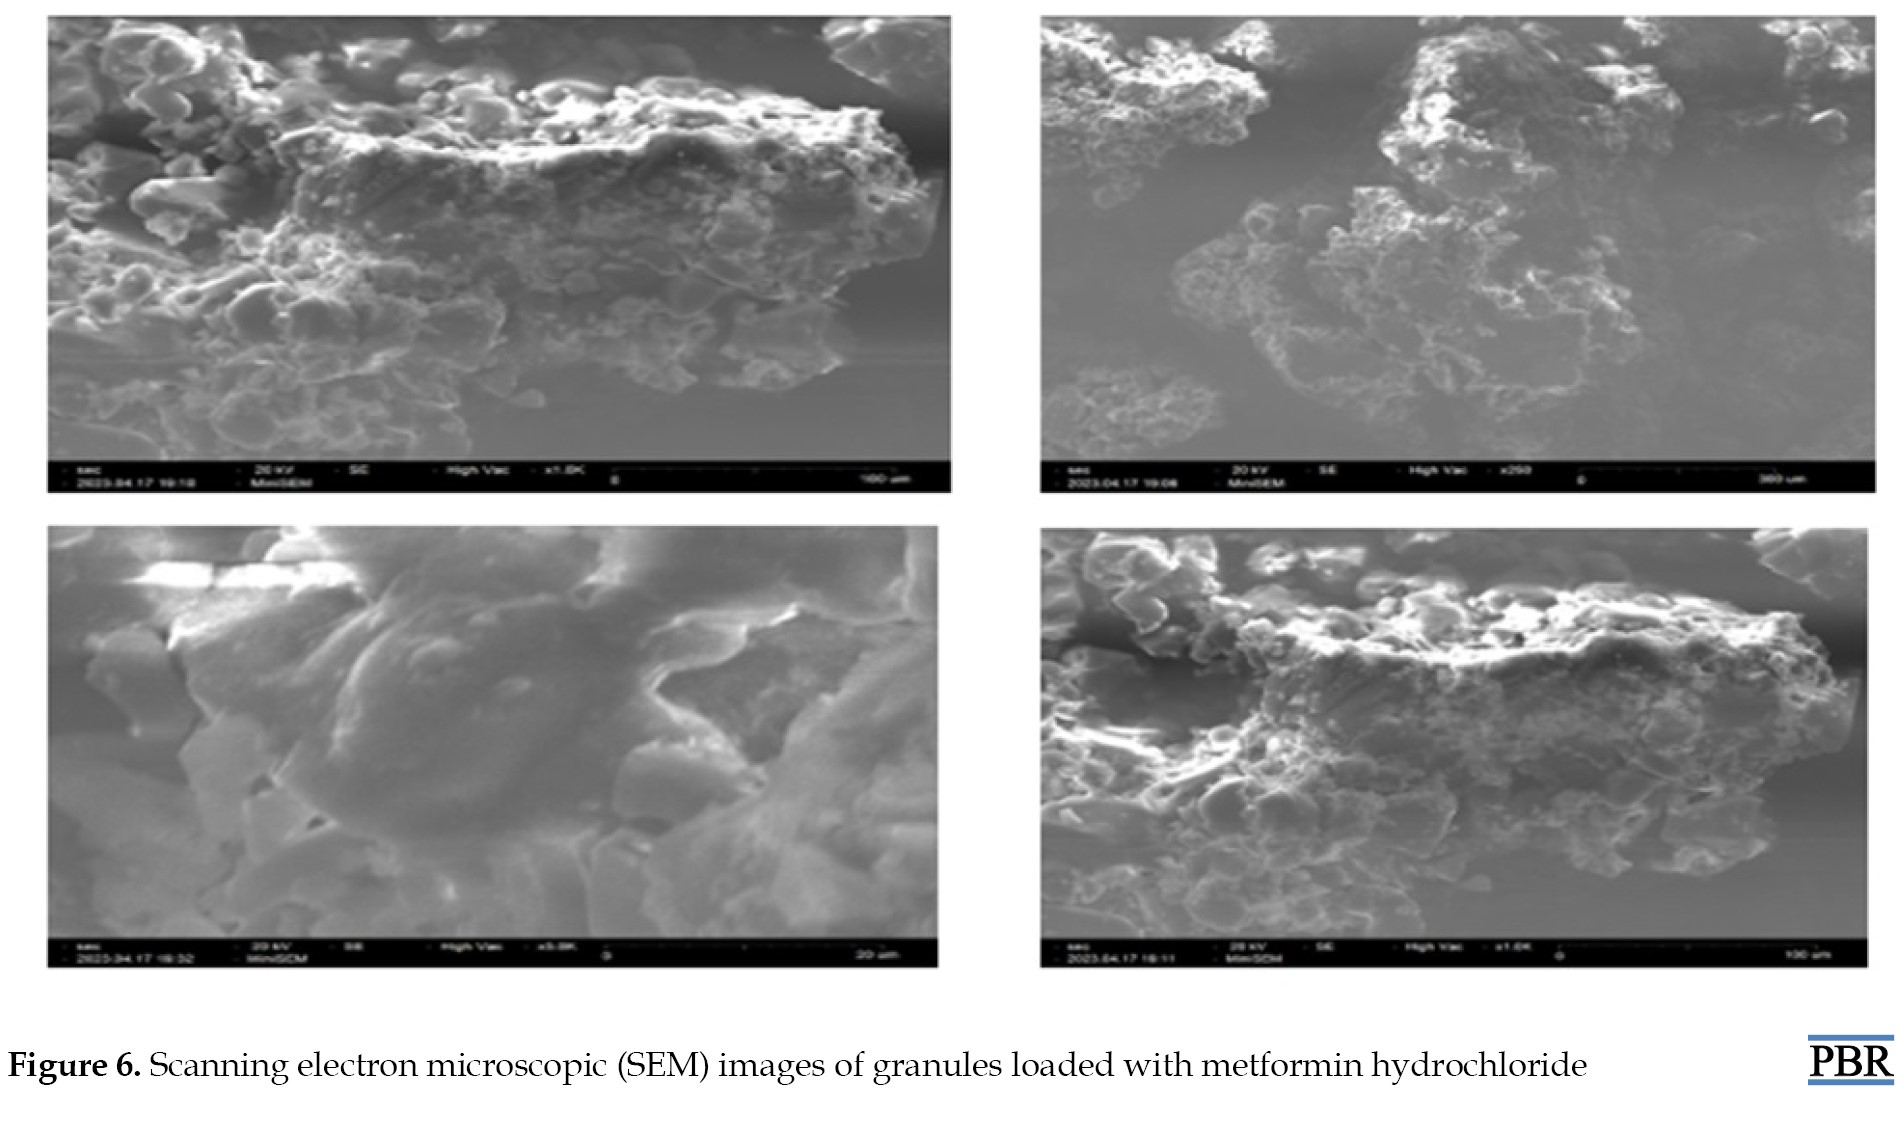
All granules showed a narrow particle size distribution ranging from 1148±152 to 1326± 26 µm (Figure 6).
Evaluation of physical parameters or post-compression parameters
Metformin hydrochloride sustained-release matrix tablets were prepared using the wet granulation method. Seven formulas in all were prepared. Table 4 shows the variance in tablet weight, hardness, friability, and content homogeneity for each formulation. The weight variation test revealed that all pill formulations' percentage deviations fell below the pharmacopeial allowed limit. All the pills had a hardness between 5.65±0.43 and 6.59±0.37 kg/cm2 or less. The fact that all occurrences of the percentage weight loss in the friability test were less than 1% suggested that all the tablets had adequate mechanical strength. The drug content of all batches was assessed by measuring sample absorbance at 233 nm with a double-beam UV spectrophotometer. The content homogeneity was higher among different formulations, and the drug content was greater than 98%, indicating consistent drug distribution in all formulations [15].
In vitro dissolution study
Metformin hydrochloride release profile from matrix tablets was examined for 12 hours in pH 6.8 phosphate buffer. Six formulations were created using HPMC K100 M and guar gum alone in various ratios. The last three formulations (MT4, MT5 and MT6) with a hydrophilic polymer, HPMC K100M alone, released 55.62%, 49.26%, and 26.32% of the drug at the end of 2 h and 98.24%, 99.24% and 86.98% at the end of 12 h, according to dissolving experiments. Also, the formulations (MT1, MT2 and MT3) with guar gum released 62.48%, 55.12%, 52.34% after 2 hours and 92.72%, 94.89%, and 97.16% after 12 hours. Figures 7, 8, 9 and 10 depict the graphical representation of different drug release kinetics.
Comparative dissolution profile (CDP) with glyciphage SR 500 tablet (marketed product)
In the CDP, both the profiles can be compared based on their overall and each sampling time of dissolution (Table 5 and Figure 11).
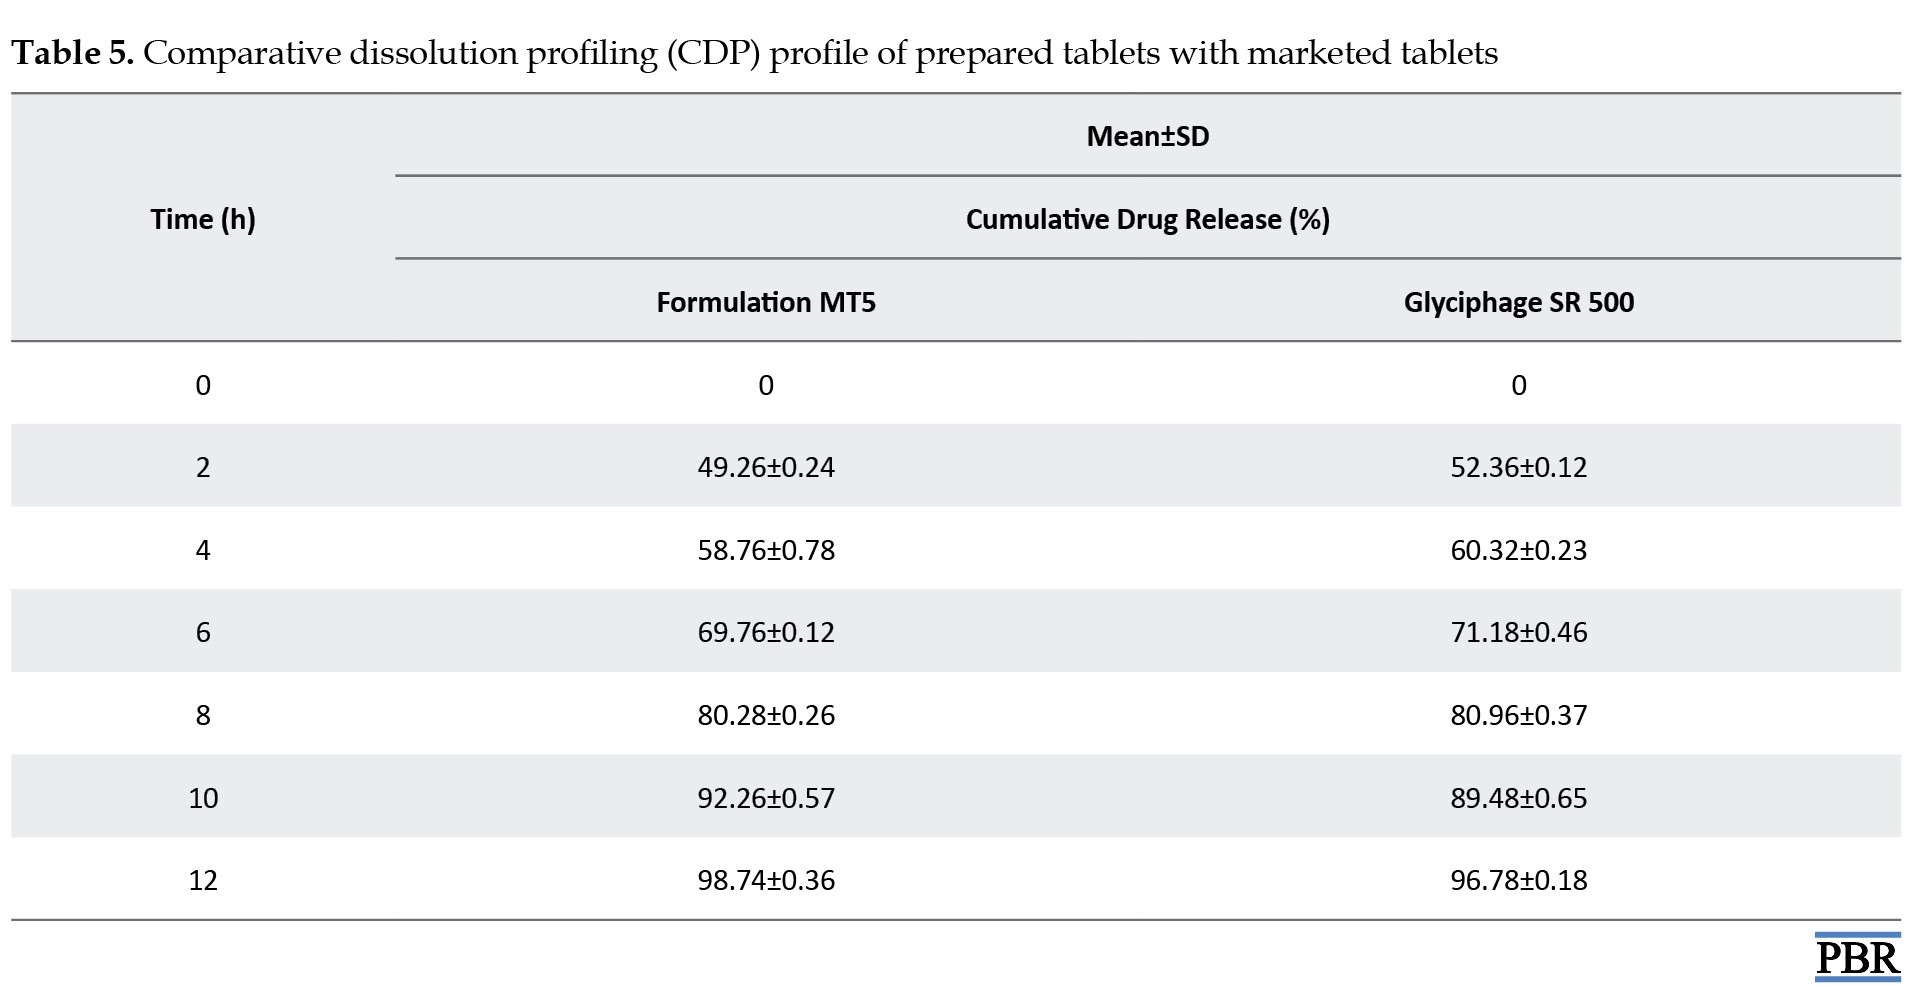
Statistical techniques that are either model-independent or -dependent can be used to compare the dissolution profiles. Two indexes, or fit factors, were introduced by Moore and Flanner in 1996 to analyze dissolution profiles pairwise. These indices are expressed as the difference factor (f1) and the similarity factor (f2) (Equation 7):
7. Similarity factor (f2)=50 log([1+1/nΣ(Rt-Tt)2]-0.5×100)
The similarity factor (f2) was found to be 75.33, and acceptable f2 values by regulatory agencies are 50-100 [22, 23]. So, it was found that the test product MT5 is almost similar to the marketed product (Equation 8):

The dissimilarity factor (f1) was 0.5 and acceptable f1 values range is 0-15 [24]. Thus, the test product MT5 does not differ significantly from the reference market product.
Conclusion
Sustained-release matrix tablets of metformin hydrochloride were formulated through wet granulation, employing HPMC K100M and guar gum as key ingredients. The release of the drug from these tablets follows Fickian-diffusion kinetics characterized by first-order behavior. Comparative dissolution data revealed favorable results, showing the likeness and variance factors between the test product and the reference market sample. It can be inferred that these sustained-release matrix tablets can reduce dosing frequency and mitigate adverse effects linked to the repetitive use of conventional metformin hydrochloride tablets. The result shows that the hydrophilic polymer HPMC K100M releases the drug similarly to the market product. Compared with HPMC K100M, guar gum does not respond satisfactorily when physical properties are considered. Guar gum showed poor hardness of tablets even in higher concentrations, and the friability of tablets is coming to the higher side, towards the limit. However, tablets containing HPMC K100M showed the best results when considering physicochemical parameters. From the above trials formulation, MT5 showed the best result where physical and chemical parameters were found within the limit, and formulation MT6 also showed a good result. Still, the hardness of the tablet became too high, which may affect future stability. Thus, the MT5 formulation gives the best result and a good sustainable drug release, where more than 99% of the drug is released within 12 hours. The comparative dissolution study with Glyciphage SR 500 also showed a similarity factor (f2) of 75.33, which resembles that the test and the market sample are almost similar. Thus, the test product MT5 needs a stability study under accelerated conditions to conclude that the formula is robust and optimized and can be upscalable.
Ethical Considerations
Compliance with ethical guidelines
There were no ethical considerations to be considered in this research.
Funding
This research did not receive any grant from funding agencies in the public, commercial, or non-profit sectors.
Authors' contributions
Conceptualization and supervision: Biplab Debnath and Kazi Asraf Ali; Data collection: Surjendu Payra and Rishav Maji; Investigation, writing the original draft, review and editing: Amlan Bishal, Bikash Gayen, Bratati Bandyopadhyay, Surjendu Payra and Rishav Maji; Final approval: All authors.
Conflict of interest
The authors declared no conflict of interest.
Acknowledgments
The authors acknowledge the Department of Pharmaceutics, Bharat Technology, for allowing them to work on this project and Maulana Abul Kalam Azad University of Technology for supporting the research.
References
Nowadays, diabetes accounts for the increasing rate of mortality in the globe. Diabetes is a chronic medical condition that disrupts the body's natural capacity to utilize food as its energy source. In diabetes, the body generates inadequate insulin, a circumstance that can result in significant health complications such as coronary artery disease, impaired vision, and kidney damage [1]. Two categories can be used for diabetes mellitus: Type I (non-insulin-dependent diabetes mellitus), which is the most prevalent, and type II (juvenile diabetes, often known as insulin-dependent diabetes). Oral drugs are the most popular methods (nasal, ocular, transdermal, rectal, and injectable) that have been researched for systemic administration via drug formulation of various doses. The oral pathway is recognized as the most widely accepted, convenient, and secure method due to its ease of application, patient receptiveness, and cost-effective production approach [2, 3].
Continual drug distribution with predictable and repeatable kinetics over a prolonged duration in circulation is the goal of novel drug delivery systems. This idea may have fewer drug-related side effects since therapeutic blood levels are controlled rather than fluctuating, patient compliance is improved because of less frequent dosing, and there is a decrease in the overall amount of medicine delivered. So, combining both controlled and prolonged release qualities in a delivery method might further increase therapeutic efficacy [4, 5].
A sustained release system for drug delivery has been created that may target administration to tissue and or sustain the rate of drug administration while maintaining a period of therapeutic activity. Usually, in a sustained-release medication system, the target is to give the medicine at a predetermined rate. So far, the system delivers the medicine, and blood levels stay safe and effective. Instead of the uncontrolled swings observed when a patient gets several doses of traditional immediate-release dosage forms, sustained-release medication delivery often produces a steady plasma concentration of the active component [6]. One dose of metformin hydrochloride can have a therapeutic effect on our bodies for up to 12 hours, making it the best medicine to employ as a sustained-release administration method. Metformin hydrochloride reduces postprandial and basal plasma glucose levels and helps diabetes patients control their blood glucose fluctuations.
When compared to another oral anti-diabetic tablet, it has distinct pharmacologic action. Metformin decreases hepatic glucose synthesis, intestinal glucose absorption, and insulin sensitivity by boosting glucose uptake and utilization. Contrary to sulfonylureas, metformin does not result in hyperinsulinemia or hypoglycemia in either non-insulin-dependent diabetes individuals or healthy individuals [7, 8, 9]. In our study, we formulated a metformin-sustained release formulation with two different rate-controlling polymers: Guar gum as a natural source of polymer and hydroxy propyl methylcellulose (HPMC) of grade K100M as a synthetic source of matrix polymer [10-12].
Materials and Methods
Materials
Metformin hydrochloride drug was supplied as a gift sample from Granules India Ltd. HPMC of grade K100M used as matrix-forming polymer was supplied by Colorcon India Pvt. Ltd. Guar gum was used as natural polymer supplied by Loba Chemie Pvt. Ltd. Povidone used as binder, microcrystalline cellulose used as diluent, talcum and magnesium stearate used as glidant and lubricant were supplied by Yarrow Chem Products.
Methods
Assessment of compatibility between drugs and excipients
After grasping the physicochemical properties of metformin hydrochloride and the accompanying excipients, a compatibility evaluation between the medication and excipients was carried out as a preliminary step in the formulation strategy. Initially, we recorded the attenuated total reflectance (ATR) infrared spectra of the pure drug and its mixture with polymers. These recordings were made both at the outset and after the samples had been stored for 15 days in a controlled environment at a temperature of 40±2°C and a relative humidity (RH) of 75%±5% within a stability chamber. The primary objective of the ATR-infrared (IR) study was to investigate potential interactions between the drug and polymers. The infrared spectrum was analyzed over a range of 4000-400 cm-1, and alterations in transmittance were observed [6, 13].
Metformin matrix tablet preparation
Metformin hydrochloride polymer matrix tablets were prepared through the wet granulation technique, utilizing PVPK30 as the binding agent. Various formulations were prepared by altering the ratios of synthetic (HPMC K100M) and natural polymers (guar gum) as per Table 1.

The following steps were followed
Phase 1: Transitioning: Metformin hydrochloride was measured and passed through a 40# screen. Microcrystalline cellulose, Hydroxypropyl methylcellulose, and guar gum were measured according to the desired quantities and passed through the same screen.
Phase 2: Dry blending: The sifted materials mentioned above were placed into a mortar and pestle and continuously mixed for 15 minutes. This process aimed to achieve a consistent mixture of the drug substance and excipients. Subsequently, the dry blended mixture's loss on drying (LOD) was assessed, along with its uniformity.
Phase 3: Binder solution preparation: The required quantity as per the formula of polyvinylpyrrolidone (PVPK30) was carefully weighed and gently added to that beaker containing distilled water of desired quantity for making optimized granules and stirred continuously to get PVPK30 completely dissolved in the solvent and formed a transparent binder solution.
Phase 4: Wet blending: The binder solution was carefully mixed with the dry mix until a cohesive wet mass was obtained. The final point of granulation was identified through constant visual monitoring of granule production.
Phase 5: Wet sifting: To get particles of the same size, wet material was filtered through a 10# screen.
Phase 6: Drying of wet granules: Wet sifted granules were allowed to dry at ambient temperature for 10 minutes before being placed in a tray drier at 50°C to attain the desired LOD of nearly 2.5%
Phase 7: Dry screening: The desired granules, after drying, were screened through a 20# screen and stored in a polybag with proper locking.
Phase 8: Pre-lubrication: Talc sifted through a 40# screen, was added to the step 7 granules, and mixed for 10 minutes to get a pre-lubricated blend.
Phase 9: Lubrication: Magnesium stearate screened through 60# and added to the pre-lubricated granules and mixed for two minutes to get the final lubricated granules ready for compression.
Phase 10: Compression of granules: Compression was done in an 8-station multi-tooling compression machine fitted with 19.5×9.0 mm caplet-shaped bi-concave punches. A steady compression force was applied to obtain a tablet hardness of 5-8 kg/cm2. We examined and recorded additional physical characteristics and then securely stored the tablets in sealed containers for future use.
Pre-compressional properties
The angle of repose: The assessment of frictional forces within powdered material and the cohesion among particles are involved in the computation of the angle of repose. This angle, which is the maximum inclination formed between the surface of a pile of powder and the horizontal plane, was determined to gauge these influences. The angle of repose was derived using either the fixed cone method or the fixed funnel method. The equation utilized for the angle of repose calculation is as follows [12, 14, 15] (Equation 1):
1. θ=tan-1 (h/r)
(where, θ=angle of repose, h=height of pile, r=radius of base of the hip of powder).
Bulk density: A precisely measured 50 g of desiccated granules were placed into a 50 mL graduated measuring cylinder. The granule bed was then leveled to ensure uniformity, and the volume occupied was recorded according to the graduation marks on the cylinder. This volume was expressed in g/mL, and its calculation was carried out using the Equation 2 [6]:

Tapped density: The tapped density of a powder is determined by the relationship between the powder's mass and the volume it occupies after being tapped for a specific duration. The process involves manually tapping the graduated cylinder containing precisely weighed powder for 500 taps. Subsequently, the volume occupied by the granules after 500 taps is recorded. Tapped density is then computed using the Equation 3 and its unit is grams per milliliter (g/mL) [6]:

Carr's index: Carr's index often called the compressibility index, serves as a valuable indicator for assessing the flow properties of powders. The equation offers a precise definition of this concept. The compressibility index is measured through the Equation 4:

Hausner's ratio: The Hausner's ratio is a numerical value that signifies the flow behavior of a powder or granular substance as it moves through a hopper during compression [6, 16]:
Hausner's ratio=Tapped density/Bulk density.
Differential scanning calorimetry
The used calorimeter was the DSC2500 from Germany, equipped with an intercooler and refrigerated cooling system. An indium standard was employed to calibrate the DSC temperature and enthalpy scale. The DSC cell was purged with nitrogen gas at a 50 mL/min flow rate via the cooling unit. Samples weighing 5-10 mg were airtight sealed within aluminum pans, and the heat transfer rate was maintained at 5°C per minute [17].
Surface morphology and particle size analysis of metformin HCl granules
Metformin HCl granules' surface morphology and shape were checked under a scanning electron microscope (SNE-3200M of SEC Global Pvt. Ltd.) at a resolution of ~15 nm, 1-30 kV voltage, and magnification of 60000. The scanning electron microscope analysis reflected that the prepared granules have a spheroidal shape with smooth surface characteristics. Particle size analysis of the optimized batch was performed using polarized light microscopy fitted with a calibrated ocular micrometer. All granules reflected a narrow particle size distribution ranging from 1148±152 to 1326±126 µm [18].
Post-compressional evaluation of matrix tablets
Weight variation: Ideally, each tablet within a batch should exhibit consistent weight, but slight variations in individual tablet weights may naturally occur. Therefore, pharmacopeia permits a limited weight variation in tablets. The USP (The United States Pharmacopeial Convention) allows for a specific percentage deviation in weight variation. To assess weight variation in each batch of tablets, 20 tablets were selected and their weights and average weights were determined using an electronic balance [19].
Hardness: The tablets' hardness across all formulations was assessed using the monsanto hardness tester. The mean hardness of three tablets was determined for each formulation and subsequently recorded.
Thickness: After removing any surface dust from 20 individual tablets, their individual crown-to-crown thickness was measured by placing them parallel between the jaws of a digimatic caliper. The measurements were documented, and the sample's Mean±SD were computed.
Friability: The friability test assesses a tablet's ability to endure wear and tear during packing, handling, and transportation. This evaluation is carried out using a device known as the "Friabilator." A roche friabilator was employed to determine the friability of the tablets. This apparatus exposes a group of tablets (six in this case) to a combination of abrasion and shock within a rotating plastic chamber, which makes 25 rpm, dropping the tablets a distance of six inches with each rotation. Initially, six tablets were weighed and placed in the Friabilator, and then the device was operated for 100 revolutions. Afterward, the tablets were de-dusted and weighed once again (Equation 5):
5.
Friability (%)=[(W0-W1)/W0]×100,
where, W0=initial weight and W1=final weight.
Drug content
Ten tablets from each formulation were measured and crushed into a fine powder using a mortar. A 100 mL phosphate buffer with a pH of 6.8 was used to extract a powder containing 500 mg of metformin hydrochloride. Subsequently, the solution was filtered using Whatman filter paper. The concentration of the drug was determined using a Shimadzu UV 1780 UV-visible spectrophotometer, maintaining an absorbance reading at 233 nm. The filtrate liquid was cautiously diluted with pH 6.8 phosphate buffer before measurement [13, 14].
Dissolution study
Utilizing a USP type II dissolution apparatus operating at a rotational velocity of 100 rpm, an in vitro investigation was conducted to assess the dissolution profile of matrix tablets containing metformin hydrochloride. The tablets were subjected to various dissolution media to simulate conditions within the gastrointestinal tract. Specifically, the dissolution media comprised 0.1 NHCl acidic buffer for the initial two-hour period, followed by 900 mL of pH 6.8 phosphate buffer for the subsequent 10-h duration. The temperature was maintained at 37±0.5°C throughout the dissolution process.
Five milliliters of aliquots of the sample solution were withdrawn from the dissolution apparatus at regular intervals. After each withdrawal, the samples were promptly replaced with a fresh dissolution medium to maintain sink conditions. Subsequently, the collected samples underwent filtration through a 0.45-μm membrane filter. The drug content was quantified in each sample by measuring the absorbance at 233 nm using a UV-spectrophotometer (SHIMADZU UV 1780) after appropriate dilution. The cumulative percentage of drug release was then calculated using an equation derived from a calibration curve [20, 21].
Drug release kinetic
The in vitro drug release data underwent fitting to the following mathematical models, aiming to analyze the release mechanism of metformin hydrochloride from sustained-release matrix tablets [3, 4, 17] (Equation 6):
6. Zero-order release model: Qt=Q0+K0t
First-order release model: LogC=LogC0+Kt/2.303
Higuchi's model: Qt=Kh√t
Korsmeyer-Peppas model: Qt/Qα=Kp tn
Here, in the context of these models, Q0, Q and Q denote the initial, t-time, and infinite-time quantities of drug dissolution, respectively. W0 and Wt represent the drug quantities in the pharmaceutical dosage form at the start and time t, respectively. C0 and C stand for the initial and time t drug concentrations. The rate constants K0, K1, Kh and Kp are determined through the linear curves of their respective models. The diffusional exponent, denoted as "n," characterizes the mechanism of drug release (Table 2).

To ascertain the relationships, regression analysis was employed to establish coefficient values between log Qt/Q and log time. The gradient of the regression equation provided the value of the diffusional exponent "n," while the antilogarithm of the intercept value facilitated the determination of Kp.
Comparative dissolution study with market product
A comparative dissolution study has been done between the formulated tablet (MT5) and marketed tablet (Glyciphage SR 500 of FRANCO-INDIAN Pharmaceuticals PVT. LTD) to check the similarity and dissimilarity factors between the two samples.
Results
ATR-IR interpretation of metformin hydrochloride
ATR-IR analysis indicated that metformin HCl displayed distinct peaks at 3367.33 and 3292.94 cm-1 originating from the primary N-H stretching vibration, along with a peak at 3147.03 cm-1 associated with secondary N-H stretching. Notably, characteristic peaks were observed at 1622.15 and 1560.64 cm-1, corresponding to C=N stretching vibrations, as shown in Figure 1.
Conducting a compatibility study between the drug and excipients to investigate physical interactions
Following the experimentation and analysis of the peaks within the ATR-IR spectra, it was noted that no interaction transpired between the drugs and excipients even after a 15-day storage period under conditions of 40±2°C and 75%±5% RH. Furthermore, there were no observable alterations in the drug's inherent characteristics, as evidenced by the ATR-IR spectra of the drug and the physical mixture. Figures 2 and 3 demonstrate that the drug maintains compatibility with all employed excipients in the formulation. Construction of a standard curve for metformin HCL utilizing pH 6.8 phosphate buffer
A standard curve was constructed with the various concentration of metformin hydrochloride and their obtained absorbance using phosphate buffer pH 6.8 in absorption maxima of 233 nm using a UV-spectrophotometer (SHIMADZU UV 1780) as shown in Figure 4.
Characterization of granules (precompression parameters)
The bulk density, tapped density, compressibility index, Hausner's ratio, and angle of repose of the lubricated blend were all investigated for all formulations (Table 3).

The bulk and tapped densities ranged from 0.77 to 0.80 g/cm3 and 0.87 to 0.95 g/cm3, respectively. By increasing the lubricant content, the flow qualities of the powder mix improved from fair to passable at first. The angle of repose values ranges from 27.65°C to 38.29°C. All the formulations' Carr's compressibility indices ranged from 11.49% to 16.13%, indicating that the powder combination had acceptable flow characteristics. The Hausner's ratio, which varied from 1.12 to 1.23, was also computed.
Discussion
Differential scanning calorimetry (DSC)
The thermal curve of pure metformin exhibited an initial flat profile followed by a sharp endothermic peak at 227°C (representing the melting point of metformin). Granules also show similar peaks (Figure 5).
Evaluation of surface morphology and particle size analysis of metformin HCl granules
All granules showed a narrow particle size distribution ranging from 1148±152 to 1326± 26 µm (Figure 6).
Evaluation of physical parameters or post-compression parameters
Metformin hydrochloride sustained-release matrix tablets were prepared using the wet granulation method. Seven formulas in all were prepared. Table 4 shows the variance in tablet weight, hardness, friability, and content homogeneity for each formulation. The weight variation test revealed that all pill formulations' percentage deviations fell below the pharmacopeial allowed limit. All the pills had a hardness between 5.65±0.43 and 6.59±0.37 kg/cm2 or less. The fact that all occurrences of the percentage weight loss in the friability test were less than 1% suggested that all the tablets had adequate mechanical strength. The drug content of all batches was assessed by measuring sample absorbance at 233 nm with a double-beam UV spectrophotometer. The content homogeneity was higher among different formulations, and the drug content was greater than 98%, indicating consistent drug distribution in all formulations [15].
In vitro dissolution study
Metformin hydrochloride release profile from matrix tablets was examined for 12 hours in pH 6.8 phosphate buffer. Six formulations were created using HPMC K100 M and guar gum alone in various ratios. The last three formulations (MT4, MT5 and MT6) with a hydrophilic polymer, HPMC K100M alone, released 55.62%, 49.26%, and 26.32% of the drug at the end of 2 h and 98.24%, 99.24% and 86.98% at the end of 12 h, according to dissolving experiments. Also, the formulations (MT1, MT2 and MT3) with guar gum released 62.48%, 55.12%, 52.34% after 2 hours and 92.72%, 94.89%, and 97.16% after 12 hours. Figures 7, 8, 9 and 10 depict the graphical representation of different drug release kinetics.
Comparative dissolution profile (CDP) with glyciphage SR 500 tablet (marketed product)
In the CDP, both the profiles can be compared based on their overall and each sampling time of dissolution (Table 5 and Figure 11).

Statistical techniques that are either model-independent or -dependent can be used to compare the dissolution profiles. Two indexes, or fit factors, were introduced by Moore and Flanner in 1996 to analyze dissolution profiles pairwise. These indices are expressed as the difference factor (f1) and the similarity factor (f2) (Equation 7):
7. Similarity factor (f2)=50 log([1+1/nΣ(Rt-Tt)2]-0.5×100)
The similarity factor (f2) was found to be 75.33, and acceptable f2 values by regulatory agencies are 50-100 [22, 23]. So, it was found that the test product MT5 is almost similar to the marketed product (Equation 8):

The dissimilarity factor (f1) was 0.5 and acceptable f1 values range is 0-15 [24]. Thus, the test product MT5 does not differ significantly from the reference market product.
Conclusion
Sustained-release matrix tablets of metformin hydrochloride were formulated through wet granulation, employing HPMC K100M and guar gum as key ingredients. The release of the drug from these tablets follows Fickian-diffusion kinetics characterized by first-order behavior. Comparative dissolution data revealed favorable results, showing the likeness and variance factors between the test product and the reference market sample. It can be inferred that these sustained-release matrix tablets can reduce dosing frequency and mitigate adverse effects linked to the repetitive use of conventional metformin hydrochloride tablets. The result shows that the hydrophilic polymer HPMC K100M releases the drug similarly to the market product. Compared with HPMC K100M, guar gum does not respond satisfactorily when physical properties are considered. Guar gum showed poor hardness of tablets even in higher concentrations, and the friability of tablets is coming to the higher side, towards the limit. However, tablets containing HPMC K100M showed the best results when considering physicochemical parameters. From the above trials formulation, MT5 showed the best result where physical and chemical parameters were found within the limit, and formulation MT6 also showed a good result. Still, the hardness of the tablet became too high, which may affect future stability. Thus, the MT5 formulation gives the best result and a good sustainable drug release, where more than 99% of the drug is released within 12 hours. The comparative dissolution study with Glyciphage SR 500 also showed a similarity factor (f2) of 75.33, which resembles that the test and the market sample are almost similar. Thus, the test product MT5 needs a stability study under accelerated conditions to conclude that the formula is robust and optimized and can be upscalable.
Ethical Considerations
Compliance with ethical guidelines
There were no ethical considerations to be considered in this research.
Funding
This research did not receive any grant from funding agencies in the public, commercial, or non-profit sectors.
Authors' contributions
Conceptualization and supervision: Biplab Debnath and Kazi Asraf Ali; Data collection: Surjendu Payra and Rishav Maji; Investigation, writing the original draft, review and editing: Amlan Bishal, Bikash Gayen, Bratati Bandyopadhyay, Surjendu Payra and Rishav Maji; Final approval: All authors.
Conflict of interest
The authors declared no conflict of interest.
Acknowledgments
The authors acknowledge the Department of Pharmaceutics, Bharat Technology, for allowing them to work on this project and Maulana Abul Kalam Azad University of Technology for supporting the research.
References
- Park K. Drug delivery research: The invention cycle. Mol Pharm. 2016; 13(7):2143-7. [DOI:10.1021/acs.molpharmaceut.6b00015] [PMID] [PMCID]
- Baryakova TH, Pogostin BH, Langer R, McHugh KJ. Overcoming barriers to patient adherence: The case for developing innovative drug delivery systems. Nat Rev Drug Discov. 2023; 22(5):387-409. [DOI:10.1038/s41573-023-00670-0] [PMID]
- Chainesh S, Chintan A, Vinod R, Nirmal S, Sachin C, Seth A, et al. An overview on gastro retentive floating microspheres. Int J Pharm Res Technol. 2012; 2(1):1-8. [DOI:10.31838/ijprt/02.01.01]
- Pant S, Badola A, Kothiyal P. A review on gastroretentive drug delivery system. Indian J Pharm Biol Res. 2016; 4(2):1. [DOI:10.30750/ijpbr.4.2.1]
- Heng PWS. Controlled release drug delivery systems. Pharm Dev Technol. 2018; 23(9):833. [DOI:10.1080/10837450.2018.1534376] [PMID]
- Patil MB, Maru AD, Bhadane JS. Formulation and evaluation of sustained release bilayer matrix tablet of glimepiride and metformin hydrochloride. Asian J Res Pharm Sci. 2021; 11(3):180-6. [DOI:10.52711/2231-5659.2021.00043]
- Park K, Wood RW, Robinson JR. Oral controlled release systems. In: Langer R, Wise D, editors. Medical applications of controlled release. Boca Raton: CRC Press; 2019. [DOI:10.1201/9780429276651-6]
- Sharma V, Singh L, Verma N. QbD enabled process variable study to develop sustained release chitosan-alginate embedded delivery system for improved patient compliance. Braz J Pharm Sci. 2022; 58:1-18. [DOI:10.1590/s2175-97902021000319803]
- Inoue T, Maeda Y, Sonoda N, Sasaki S, Kabemura T, Kobayashi K, Inoguchi T. Hyperinsulinemia and sulfonylurea use are independently associated with left ventricular diastolic dysfunction in patients with type 2 diabetes mellitus with suboptimal blood glucose control. BMJ Open Diabetes Res Care. 2016 18; 4(1):e000223. [DOI: 10.1136/bmjdrc-2016-000223] [PMID]
- Kutniewska SE, Krówczyński A, Kamiński R, Jarzembska KN, Pillet S, Wenger E, et al. Photocrystallographic and spectroscopic studies of a model (N,N,O)-donor square-planar nickel(II) nitro complex: In search of high-conversion and stable photoswitchable materials. IUCrJ. 2020; 7(Pt 6):1188-98. [DOI:10.1201/9780429282546] [PMID] [PMCID]
- Augsburger LL, Hoag SW. Pharmaceutical dosage forms-tablets. Boca Raton: CRC press; 2013. [DOI:10.1201/b15115]
- Kaur G, Grewal J, Jyoti K, Jain UK, Chandra R, Madan J. Oral controlled and sustained drug delivery systems: Concepts, advances, preclinical, and clinical status. In: Grumezescu AM, editor. Drug targeting and stimuli sensitive drug delivery systems. Amsterdam: Elsevier; 2018. [DOI:10.1016/b978-0-12-813689-8.00015-x]
- Ozoude CH, Azubuike CP, Ologunagba MO, Tonuewa SS, Igwilo CI. Formulation and development of metformin-loaded microspheres using Khaya senegalensis (Meliaceae) gum as co-polymer. Future J Pharm Sci. 2020; 6(1):1-11. [DOI:10.1186/s43094-020-00139-6]
- Kumar AR, Aeila ASS. Sustained release matrix type drug delivery system: An overview. World J Pharma Pharm Sci. 2019; 8(12):470-80. [Link]
- Saeedi M, Akbari J, Semnani K, Hashemi SMH, Ghasemi S, Tahmasbi N, et al. Controlling atorvastatin release from liquisolid systems. J Dispers Sci Technol. 2022; 43(3):375-84. [DOI:10.1080/01932691.2020.1842211]
- Nautyal U, Gupta D. Oral sustained release tablets: an overview with a special emphasis on matrix tablet. Int J Health Biol Sci. 2020; 3(1):6-13. [Link]
- Vaingankar P, Amin P. Continuous melt granulation to develop high drug loaded sustained release tablet of Metformin HCl. Asian J Pharm Sci. 2017; 12(1):37-50. [DOI:10.1016/j.ajps.2016.08.005] [PMID] [PMCID]
- Roy H, Nayak BS. Formulation and design of sustained release matrix tablets of lamivudine: Combination of chitosan and HPMC. Am J Pharm Health Res. 2017; 5(2):01-10. [Link]
- Saeedi M, Akbari J, Enayatifard R, Morteza-Semnani K, Mohammad S, Hashemi H, et al. Liquisolid tablet: An effective approach towards improvement of dissolution rate of famotidine as poorly soluble drugs. Int J Pharm Sci Res. 2021; 12(2):803-12. [Link]
- Pawar SS, Malpure PS, Surana SS, Bhadane JS. Formulation and evaluation of sustained release matrix tablet of captopril. J Drug Deliv Ther. 2019; 9(4A):260-8. [DOI:10.22270/jddt.v9i4-A.3406]
- Jire DS, Gosavi NS, Badhe RB, Jagdale DH. Mouth dissolving tablet: A novel drug delivery system. Asian J Pharm Res. 2021; 11(3):180-6. [DOI:10.52711/2231-5691.2021.00033]
- Brown CK, Chokshi HP, Nickerson B, Reed RA, Rohrs BR, Shah PA. Dissolution testing of poorly soluble compounds. Pharm Tech. 2004; 28:56-43. [Link]
- Suarez-Sharp S, Abend A, Hoffelder T, Leblond D, Delvadia P, Kovacs E, et al. In Vitro dissolution profiles similarity assessment in support of drug product quality: What, how, when-workshop summary report. AAPS J. 2020; 22(4):74. [DOI:10.1208/s12248-020-00458-9] [PMID]
- Kassaye L, Genete G. Evaluation and comparison of in-vitro dissolution profiles for different brands of amoxicillin capsules. Afr Health Sci. 2013; 13(2):369-75. [DOI:10.4314/ahs.v13i2.25] [PMID] [PMCID]
Type of Study: Original Research |
Subject:
Pharmaceutics
| Rights and permissions | |
 |
This work is licensed under a Creative Commons Attribution-NonCommercial 4.0 International License. |


